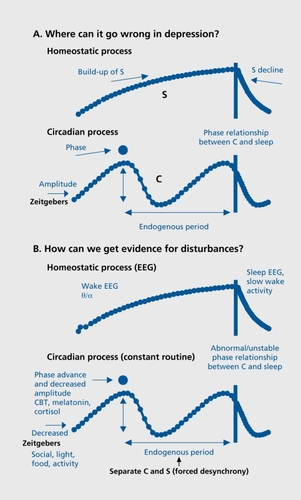
Figure 1. A. The two-process model of sleep regulation, considered in terms of what could go wrong in depression. The homeostatic component (process S) builds up during wakefulness and declines during sleep. The circadian pacemaker (process C) ticks along at its individual (genetically programmed) endogenous period. Decreased amplitude would increase variability of daily timing and it would be more vulnerable to phase shifts. If the rhythm was advanced or delayed in phase, the resultant altered phase relationships between process C and sleep timing could explain many depressive phenomena. B. Biological markers of process S and process C. The exponential rise in sleep pressure can be followed by theta-alpha (θ/α) power in the wake electroencephalogram (EEG). The exponential decline in sleep pressure is evident in slow-wave activity in the sleep EEG. In a constant routine protocol, the rhythms of core body temperature (CBT), melatonin, and Cortisol provide estimates of circadian phase and amplitude. In a forced desynchrony protocol, the endogenous period of the circadian pacemaker can be reduced as well as the relative contributions of process C and process S to any given measure, from psychological to physiological.
Table I. Chronobiological therapies of major depression. Therapies in italics are for one or two studies only. TSD, total sleep deprivation; PSD, partial sleep deprivation; rTMS, repetitive transcranial magnetic stimulation; SSRI, selective serotonin reuptake inhibitor; SAD, seasonal affective disorder; MD, major depression.