441
Views
10
CrossRef citations to date
0
Altmetric
State of the Art

Expression profiling of drug response - from genes to pathways

El perfil de expresión de la respuesta a los fármacos: desde los genes a las vías involucradas

Profilage de l'expression de la réponse au médicament: des gènes aux voies d'accès

&
Pages 283-293 | Published online: 01 Apr 2022

Figures & data

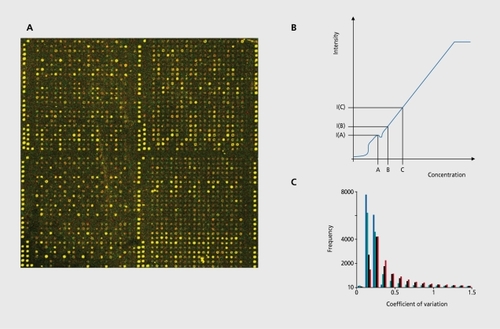
Figure 1. A: False-color image generated from a two-color hybridization on a cDNA array.Citation17 B: Linearity between concentration and measured signal intensity is the underlying assumption of microarray data analysis. Whereas the expression ratio of genes B and C yield a valid measure of the concentration differences, the ratio of genes A and B is misleading because of nonlinear deviations in the low intensity region. C: Histogram of the coefficient of variation for genes from simulated array imagesCitation26 using three different image analysis programs for data analysis that can be classified as manual (red), semi-automatic (black) and fully automatic (green). The blue bars show the counts for the simulated input data.
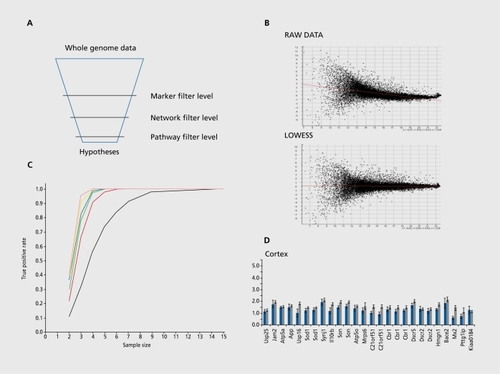
Figure 2. A: Schematic description of the biomarker discovery process. B: Nonlinear dependencies of fold change (Y-axis) and signal strength (X-axis) in raw data and LOWESS normalization for the compensation of these effects. This method fits the data sets by local polynomials using weighted least squares. C: Dependency of detection power for expression differences (Y-axis) from the number of experimental replicates. Different curves correspond to different expression ratios: 1.5 (black), 2 (red), 2.5 (green), 3 (blue), 5 (yellow) and 10 (magenta). D: Robust statistical testing identifies even small expression changes (~1.5). Microarray expression changes (gray bars) verified by RT-PCR(red bars) in mouse cortex (kindly provided by Marc Sultan and Marie-Laure Yaspo).Citation34 LOWESS, locally weighted polynomial regression