1,093
Views
79
CrossRef citations to date
0
Altmetric
Clinical Research

Visual hallucinatory syndromes: past, present, and future

Síndromes alucinatorios visuales: pasado, presente y futuro

Syndromes hallucinatoires visuels: passé, présent et futur

Pages 173-189 | Published online: 01 Apr 2022

Figures & data

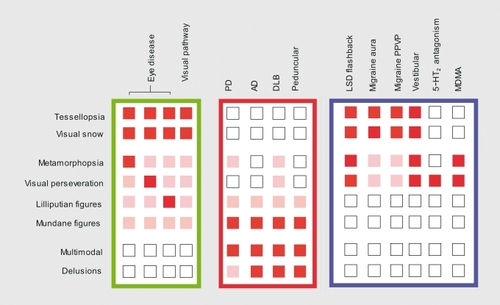
Table I. de Morsier's classification of visual hallucinatory syndromes.

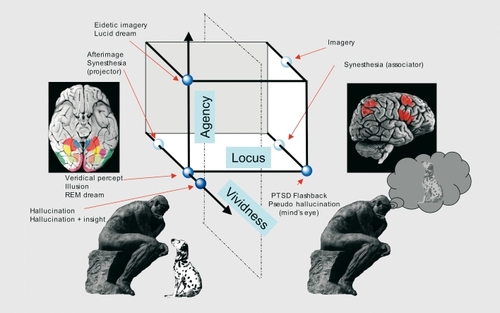
Table II. Visual hallucinatory syndromes not included by de Morsier. LSD, lysergic acid diethylamide; MDMA, 3,4-methylenedioxymethamphetamine; PTSD, post-traumatic stress disorder

Figure 1. The three Charles Bonnet syndromes (CBS). Key figures in the history of each syndrome are shown, together with their definition and a representation of the patients included. Blue rectangles = conditions associated with visual hallucinations; light green (simple) and dark green (complex) rectangles = visual hallucinations, red dashed rectangle = eye disease. The subset of patients with CBS is shown in yellow, darkened for those patients common to all three definitions. The size of each rectangle or its regions of intersection are not indicative of the number of patients involved. See text for further details.

Portrait of de Morsier reproduced with permission of the Centre d'iconographie Genevoise, coll. BPU University of Geneva. Photo of de Ajuriaguerra reproduced with permission of the University Hospital of Geneva. Photo of Peter Rabins reproduced with permission of Dr Rabins.

Figure 1. The three Charles Bonnet syndromes (CBS). Key figures in the history of each syndrome are shown, together with their definition and a representation of the patients included. Blue rectangles = conditions associated with visual hallucinations; light green (simple) and dark green (complex) rectangles = visual hallucinations, red dashed rectangle = eye disease. The subset of patients with CBS is shown in yellow, darkened for those patients common to all three definitions. The size of each rectangle or its regions of intersection are not indicative of the number of patients involved. See text for further details. Portrait of de Morsier reproduced with permission of the Centre d'iconographie Genevoise, coll. BPU University of Geneva. Photo of de Ajuriaguerra reproduced with permission of the University Hospital of Geneva. Photo of Peter Rabins reproduced with permission of Dr Rabins.

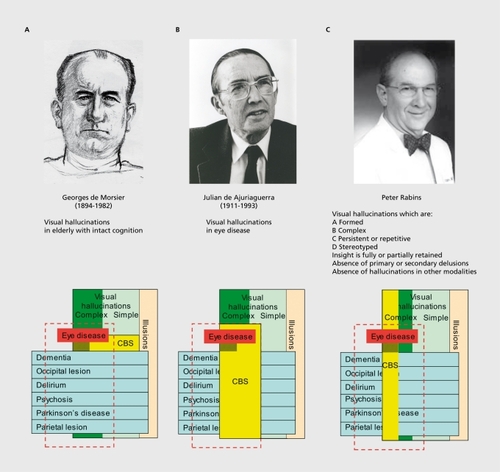
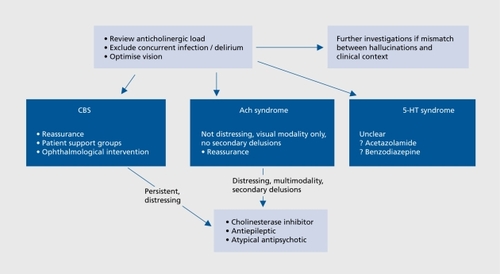
Table III. Treatment approaches. 5-HT, serotonin; CNS, central nervous system

Figure 2. The neurophenomenological classification of visual perceptual experience. A three-dimensional space is represented with axes: (i) perceptual locus - external or in the mind's eye; (ii) sense of agency or volitional control; (iii) vividness (also coded by color saturation). Each class of visual perceptual experience is represented by a sphere. The dotted vertical plane divides those experiences related predominantly to activity in specialized visual cortex (left of figure) from those experiences related predominantly to activity in a network of parietal and frontal areas (right of figure). See text for further details.
Figure 3. Visual perceptual syndromes. A range of clinical conditions (columns) are cross-tabulated with visual symptoms (rows). Of patients with visual perceptual pathology in a given condition, the percentage reporting each symptom category is coded red (> 20 %), pink (10 % to 20 %) or white (not reported or <10 %) See text for source references. Multimodal refers to visual hallucinations occurring in combination with those in another sensory modality, either simultaneously or on separate occasions. No systematic phenomenological surveys of visual perceptual phenomenology have been performed for peduncular lesions, migraine aura, persistent positive visual phenomena (PPVP) in migraine, 5-HT2 antagonism, vestibular disorders or MDMA use, the percentage coding in these disorders is therefore estimated from case reports. The green, red, and purple rectangles demarcate three syndromic patterns. See text for further details. PD, Parkinson's disease; AD, Alzheimer's disease; DLB, dementia with Lewy bodies; LSD; lysergic acid diethylamine; 5-HT, serotonin, MDMA, 3,4-methylenedioxymethamphetamine.
Figure 4. Caricatures of the deafferentation (CBS), cholinergic (Ach) and serotonergic (5-HT) visual perceptual syndromes. The deafferentation syndrome has three subsyndromic forms shown as light green regions, top = parietal; middle = superior temporal; bottom = ventral temporal)
Figure 5. Treatment algorithm for the three visual perceptual syndromes. CBS, Charles Bonnet syndrome; Ach, anticholinergic; 5-HT, serotonin