A new paradigm for the prediction of antidepressant treatment response
Un nuevo paradigma para predecir la respuesta al tratamiento antidepresivo
Un nouweau paradigme de prédiction de la réponse au traitement antidépresseur
Andrew F. LeuchterLaboratory of Brain Behavior, and Pharmacology, and the Depression Research and Clinical Program, Semel Institute for Neuroscience and Human Behavior at UCLA, and the Department of Psychiatry and Biobehavioral Sciences, David Geffen School of Medicine at UCLA, Los Angeles, California, USACorrespondence[email protected]
,
Ian A. CookLaboratory of Brain Behavior, and Pharmacology, and the Depression Research and Clinical Program, Semel Institute for Neuroscience and Human Behavior at UCLA, and the Department of Psychiatry and Biobehavioral Sciences, David Geffen School of Medicine at UCLA, Los Angeles, California, USA
,
Aimee M. HunterLaboratory of Brain Behavior, and Pharmacology, and the Depression Research and Clinical Program, Semel Institute for Neuroscience and Human Behavior at UCLA, and the Department of Psychiatry and Biobehavioral Sciences, David Geffen School of Medicine at UCLA, Los Angeles, California, USA
&
Alexander S. KorbLaboratory of Brain Behavior, and Pharmacology, and the Depression Research and Clinical Program, Semel Institute for Neuroscience and Human Behavior at UCLA, and the Department of Psychiatry and Biobehavioral Sciences, David Geffen School of Medicine at UCLA, Los Angeles, California, USA
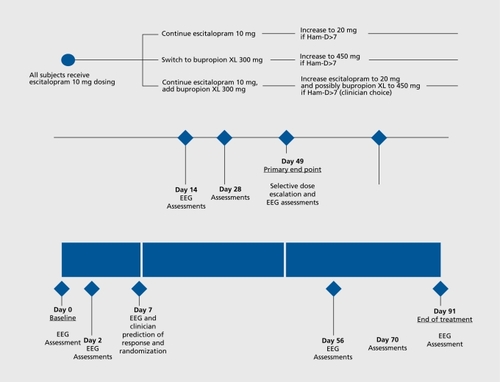
Figure 1.
Study flow chart. Ham-D, Hamilton Depression Rating Scale; SSRI, selective serotonin reuptake inhibitor; EEG, electroencephalography
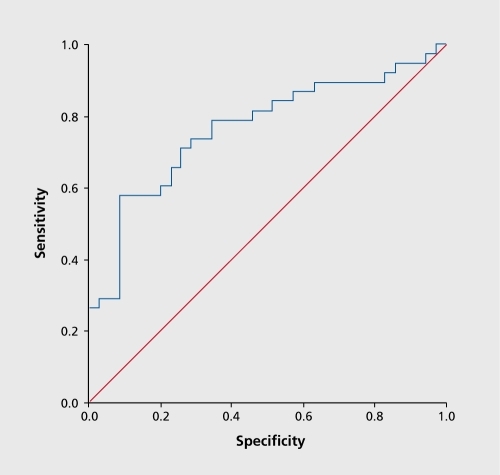
Figure 2.
Receiver Operating Characteristic curve for ATR prediction of response to escitalopram treatment. ATR, Antidepressant Treatment Response index