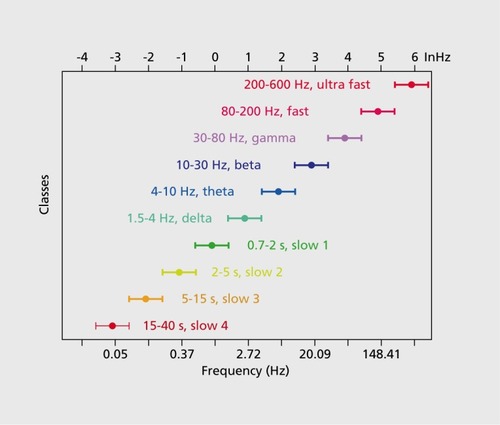
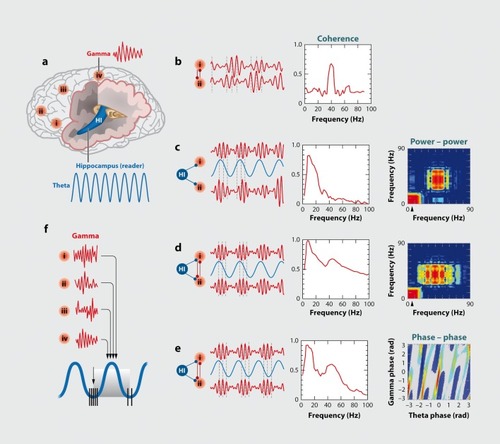
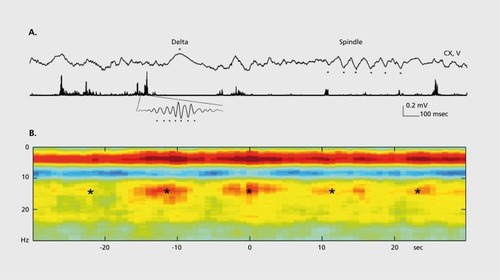
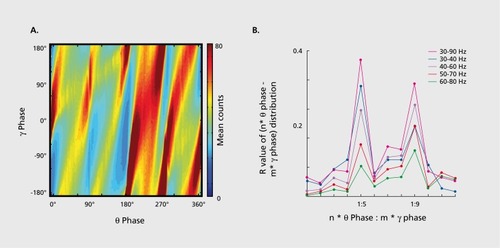
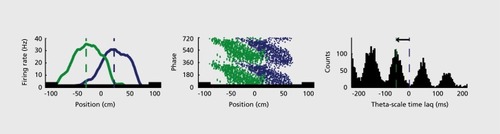
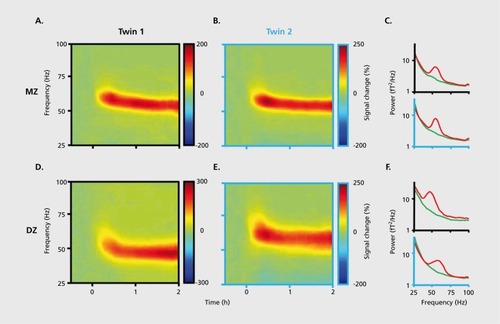
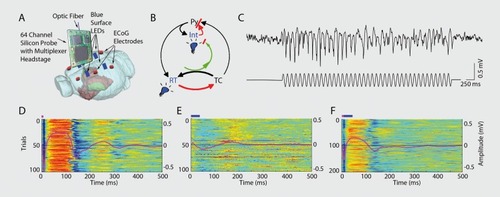
4,285
Views
336
CrossRef citations to date
0
Altmetric
State of the Art

Brain rhythms and neural syntax: implications for efficient coding of cognitive content and neuropsychiatric disease.

Ritmos cerebrates y sintaxis neural: consecuencias para una codificación eficiente del contenido cognitivo y la enfermedad neuropsiquiátrica

Rythmes cérébraux et syntaxe neuronale: implications pour un codage efficace du contenu cognitif et des maladies neuropsychiatriques

&
Pages 345-367 | Published online: 01 Apr 2022

Figures & data

Figure 1. A system of interacting brain oscillations. Oscillatory classes in the cortex. Note the linear progression of the frequency classes (written next to commonly used name for each rhythm), on the natural log scale. This geometrical order is despite the fact that these frequency families were defined based on phenomenological correlates. Reproduced from ref 7: Buzsaki G, Draguhn A. Neuronal oscillations in cortical networks. Science. 2004;304:1926-1929. Copyright © American Association for the Advancement of Science 2004
Figure 2. Oscillations can route information by multiple mechanisms, (a) View of the brain showing location of computation as revealed by transient γ oscillations (i-iv) and θ oscillation in the hippocampus (HI) entorhinal cortex (EC). Brain rhythms of the same and different kind (eg, θ, γ) can influence each other within and across structures by modulating the phase and/or the amplitude of the oscillations, (b) Phasephase coupling of “synthetic” γ oscillations between two structures for illustration purposes. Phase is shared between the waves — see dashed gray lines and coherence plot regardless of amplitude. Coherence spectrum between the two rhythms can reveal the strength of phase coupling, (c) Cross-frequency phase-amplitude coupling. Here the phase relationship between the respective γ oscillations can be random but the envelope of γ waves at both sites is modulated by the common θ rhythm and can be revealed by the power-power correlation (comodugram; right), (d) In addition to phase-amplitude coupling (θ-γ), the two sites may display γ coherence as well; a sign of strong inter-site interaction, (e) Cross-frequency phase-phase coupling. See also Figure 4. (f) A slow rhythm (eg, hippocampal θ oscillation) can modulate γ power at multiple neocortical areas so that the results of the local computations are returned to the hippocampus when the hippocampal network is in “readiness” phase of the slow oscillation. Reproduced from ref 13: Buzsáki G, WangX-J. Mechanisms of γ oscillations. Ann Rev Neurosci. 2012;35:203-225. Copyright © Annual Reviews 2012
Figure 3. Cross-frequency coupling contributes to the hierarchy of brain rhythms, (a) Local field potential trace from layer 5 of the rat neocortex (1 Hz - 3 kHz) and a filtered (140-240 Hz) and rectified derivative of a trace from the hippocampal CA1 pyramidal layer, illustrating the emergence of “ripples.” One ripple event is shown at an expanded time scale. Peak of a δ wave and troughs of a sleep spindle are marked by asterisks. (b) Hippocampal ripple-triggered power spectrogram of neocortical activity centered on hippocampal ripples. Note that ripple activity is modulated by the sleep spindles (as revealed by the power in the 10-1 8 Hz band), and both events are modulated by the slow oscillation (strong red band 0-3 Hz), and all three oscillations are biased by the phase of the ultraslow rhythm (approximately 0.1 Hz, asterisks). CX, V, Cortex, Layer 5 Reproduced from ref 21: Sirota A, Csicsvari J, Buhl D, Buzsaki G. Communication between neocortex and hippocampus during sleep in rodents. Proc Natl AcadSciUSA. 2003;100:2065-2069. Copyright © National Academy of Science 2003
Figure 4. Phase-phase coupling between oscillations, (a) Plot illustrates phase-phase relationship between hippocampal θ and γ oscillations. Note that faster and slower γ oscillations (different diagonal bands) are simultaneously present, (b) Mean radial distance values (R value) from the distribution of the difference between θ and γ phases calculated for different n:m (θ:γ) relationships (1:1, 1:2....1:12) for several filtered γ frequency bands. Note large peaks (also known as Arnold's tongues) at 5 (mainly for band 30-40 Hz) and 9 (mainly for 50-80 Hz). Reproduced from ref 1 14: Belluscio MA, Mizuseki K, Schmidt R, Kempter R, Buzsaki G. Cross-frequency phase-phase coupling between θ and γ oscillations in the hippocampus. J Neurosci. 2012:32:423-435. Copyright © Society for Neuroscience 2012
Figure 5. Multiple temporal representations in the hippocampus. Two CA1 pyramidal cells (green and blue) with overlapping place field representations on a linear track (black). It takes several seconds for the animal to pass from the peak (dashed line) of place field 1 (green) to place field 2 (blue). Middle panel, plots of the spikes as a function of the rat's position on the track and their θ phase. Each dot is an action potential. Ordinate, phase of θ shown twice for better visualization. Note that as the animal moves closer to the center of the place field for each cell, say running from left to right, the action potentials move closer to the 180-degree phase of the oscillation and as it moves away, the action potentials move further away. Right panel, time offset between the spikes of the reference (blue) and the green neurons at the θ time scale (arrow), as shown in a cross-correlogram. The time offsets of place cell spikes within the θ cycle and their distance (or travel time) representation are correlated. Reproduced from ref 128: Diba K, Buzsaki G. Hippocampal network dynamics constrain the time lag between pyramidal cells across modified environments. J Neurosci. 2008:28:1 3448-1 3456. Copyright © Society for Neuroscience 2008
Figure 6. Brain rhythms are gene-regulated and unique, (a, b) Time-frequency display of visually induced γ band activity in a monozygotic (MZ) twin pair. C, Average spectra! power of magnetoencephalogram activity during control (green) and visual stimulation (red) epochs. D-F, same as A-C in a dizygotic (DZ) twin pair. Note stronger similarity of frequency and temporal dynamic changes of the MEG in the MZ pair relative to the DZ pair. Reproduced from ref 198: van Pelt S, Boomsma Dl, Fries P. Magnetoencephalography in twins reveals a strong genetic determination of the peak frequency of visually induced y-band synchronization. J Neurosci. 201 2:32:3388-3392. Copyright © Society for Neuroscience 2012
Figure 7. Closed-loop interaction in the thalamocortical loop, (a) Experimental setup. Optic fiber is placed into the reticular nucleus of thalamus in a FValb-IRES-Cre:Ai32 double transgenic mouse to induce spike-wave seizure-like pattern; shown in (c). Blue LEDs (squares) placed epidurally at two positions in each hemisphere, (b). Schematic of the reverberation in the thalamocortical loop. Neurons of the thalamus: reticular nucleus cells (RT), thalamocortical projection neurons TC). Neurons of the cortex: pyramidal cells (Py) and inhibitory interneurons (int). (d) Light stimulation of the pan/albumin RT neurons alone induces spike-waves, whereas light stimulation of cortical pan/albumin interneurons alone induces rebound excitation in cortical pyramidal cells (Py). Combined and phase shifted stimulation of RT and cortex attenuates the induced spike-wave activity. Reproduced from ref 252: Berenyi A, Belluscio M, Mao D, Buzsaki G. Closed-loop control of epilepsy by transcranial electrical stimulation. Science. 2012;337:735-737. Copyright ©American Association for the Advancement of Science 2012