1,970
Views
27
CrossRef citations to date
0
Altmetric
Brief Report

Simultaneous EEG and fMRI: towards the characterization of structure and dynamics of brain networks

Electroencefalograma y resonancia magnética funcional simultáneos: hacia la caracterización de la estructura y dinámica de las redes cerebrales

EEG et IRMf simultanés: vers la caractérisation de la structure et de la dynamique des réseaux cérébraux

Pages 381-386 | Published online: 01 Apr 2022

Figures & data

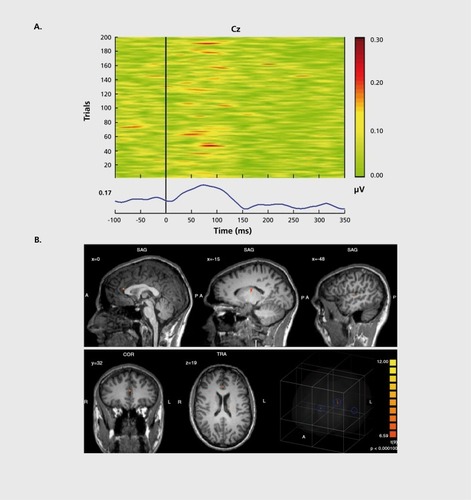
Figure 1. EEG-informed fMRI analysis in an auditory choice reaction task. A) EEG single-trial data of a typical data set at electrode Cz. In many trials, a GBR between 30 and 100 ms post-stimulus is present. However, the amplitudes of the GBR are variable over time. This variability can be used for specific predictions of the related BOLD signal. In the lower part of the figure, the corresponding averaged GBR is shown. B) GBR-specific BOLD activation based on the single-trial coupling of GBR amplitude variation and corresponding BOLD activation. Activations can be seen in the left auditory cortex (gyrus temporalis superior; Brodmann area 41/22, highest t-value 8.3), the thalamus (highest t-value 7.6) and the anterior cingulate cortex (Brodmann area 24, highest t-value 10.1). In the lower right corner, a glass brain view is provided, demonstrating a 3D view of the three abovementioned clusters. Activations are shown at P<0.0001 (random effects analysis, uncorrected for multiple testing). EEG, electroencephalography; fMRI, functional magnetic resonance imaging; GBR, gamma-band response; BOLD, blood oxygenation level-dependent Reproduced from ref 14: Mulert C, Leicht G, Hepp P, et al. Single-trial coupling of the gamma-band response and the corresponding BOLD signal. Neuroimage. 2010;49:2238-2247. Copyright © Elsevier 2010