Affective neuroimaging in generalized anxiety disorder: an integrated review
Neuroimágenes de las emociones en el trastorno de ansiedad generalizada: una revisión integradora
Neuro-imagerie des émotions et anxiété généralisée : une analyse globale
Gregory A. FonzoDepartment of Psychiatry and Behavioral Sciences, Stanford University School of Medicine, Stanford, California, USA; Stanford Neurosciences Institute, Stanford University, Stanford, California, USA; Veterans Affairs Palo Alto Healthcare System and the Sierra-Pacific Mental Illness Research, Education, and Clinical Center (MIRECC), Palo Alto, California, USACorrespondence[email protected]
&
Amit EtkinDepartment of Psychiatry and Behavioral Sciences, Stanford University School of Medicine, Stanford, California, USA; Stanford Neurosciences Institute, Stanford University, Stanford, California, USA; Veterans Affairs Palo Alto Healthcare System and the Sierra-Pacific Mental Illness Research, Education, and Clinical Center (MIRECC), Palo Alto, California, USA
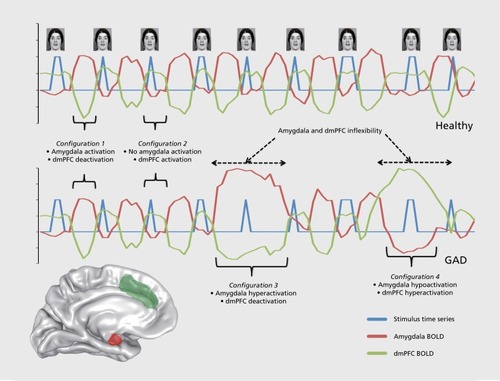
Figure 1 Variability of task-induced blood oxygenation—level dependent activity in generalized anxiety disorder: a proposed model. The figure illustrates hypothetical inversely-correlated BOLD signal time courses for the dorsomedial prefrontal cortex (green line), amygdala (red line), and the stimulus (fearful face) during an affective imaging task in healthy controls (graph on top) and individuals with generalized anxiety disorder (graph on bottom). The black brackets indicate periods of the time course that refer to distinct “configurations” of conjoint activity between the dorsomedial prefrontal cortex and amygdala. In healthy individuals, only the first two configurations are represented in the regional time courses. In the individuals with generalized anxiety disorder, however, there are several other distinct configurations of conjoint activity that are represented over the course of the task. Dotted lines indicate periods of the time course that reflect periods of inflexibility, or a failure to change configurations of conjoint brain activity, which may be secondary to brain function being more heavily influenced in individuals with generalized anxiety disorder by stimulus-independent factors. A brain surface is depicted in the lower left hand corner displaying the regions of interest depicted in the hypothetical graphs. BOLD, blood oxygenation level—dependent response; dmPFC, dorsomedial prefrontal cortex; GAD, generalized anxiety disorder.
MonkCS.NelsonEE.McClureEB.et alVentrolateral prefrontal cortex activation and attentional bias in response to angry faces in adolescents with generalized anxiety disorder.Am J Psychiatry.200616361091109716741211
WhiteSF.GeraciM.LewisE.et alPrediction error representation in individuals with generalized anxiety disorder during passive avoidance.Am J Psychiatry.2016174211011727631963
McClureEB.MonkCS.NelsonEE.et alAbnormal attention modulation of fear circuit function in pediatric generalized anxiety disorder.Arch Gen Psychiatry.20076419710617199059
WhalenPJ.JohnstoneT.SomervilleLH.et alA functional magnetic resonance imaging predictor of treatment response to venlafaxine in generalized anxiety disorder.Biol Psychiatry.200863985886317964548
BlairK.ShaywitzJ.SmithBW.et alResponse to emotional expressions in generalized social phobia and generalized anxiety disorder: evidence for separate disorders.Am J Psychiatry.200816591193120218483136
MonkCS.TelzerEH.MoggK.et alAmygdala and ventrolateral prefrontal cortex activation to masked angry faces in children and adolescents with generalized anxiety disorder.Arch Gen Psychiatry.200865556857618458208
NitschkeJB.SarinopoulosI.OathesDJ.et alAnticipatory activation in the amygdala and anterior cingulate in generalized anxiety disorder and prediction of treatment response.Am J Psychiatry.2009166330231019122007
PaulesuE.SambugaroE.TortiT.et alNeural correlates of worry in generalized anxiety disorder and in normal controls: a functional MRI study.Psychol Med.201040111712419419593
EtkinA.PraterKE.HoeftF.MenonV.SchatzbergAF.Failure of anterior cingulate activation and connectivity with the amygdala during implicit regulation of emotional processing in generalized anxiety disorder.Am J Psychiatry.2010167554555420123913
MaslowskyJ.MoggK.BradleyBP.et alA preliminary investigation of neural correlates of treatment in adolescents with generalized anxiety disorder.J Child Adolesc Psychopharmacol.201020210511120415605
EtkinA.SchatzbergAF.Common abnormalities and disorder-specific compensation during implicit regulation of emotional processing in generalized anxiety and major depressive disorders.Am J Psychiatry.2011168996897821632648
PalmME.ElliottR.McKieS.DeakinJF.AndersonIM.Attenuated responses to emotional expressions in women with generalized anxiety disorder.Psychol Med.20114151009101820716396
PriceRB.EldrethDA.MohlmanJ.Deficient prefrontal attentional control in late-life generalized anxiety disorder: an fMRI investigation.Transl Psychiatry.20111e4622833192
BlairKS.GeraciM.SmithBW.et alReduced dorsal anterior cingulate cortical activity during emotional regulation and top-down attentional control in generalized social phobia, generalized anxiety disorder, and comorbid generalized social phobia/generalized anxiety disorder.Biol Psychiatry.201272647648222592057
StrawnJR.BitterSM.WeberWA.et alNeurocircuitry of generalized anxiety disorder in adolescents: a pilot functional neuroimaging and functional connectivity study.Depress Anxiety.2012291193994722628125
YassaMA.HazlettRL.StarkCE.Hoehn-SaricR.Functional MRI of the amygdala and bed nucleus of the stria terminalis during conditions of uncertainty in generalized anxiety disorder.J Psychiatr Res.20124681045105222575329
BallTM.RamsawhHJ.Campbell-SillsL.PaulusMP.SteinMB.Prefrontal dysfunction during emotion regulation in generalized anxiety and panic disorders.Psychol Med.20134371475148623111120
GreenbergT.CarlsonJM.ChaJ.HajcakG.Mujica-ParodiLR.Ventromedial prefrontal cortex reactivity is altered in generalized anxiety disorder during fear generalization.Depress Anxiety.201330324225023139148
HolzelBK.HogeEA.GreveDN.et alNeural mechanisms of symptom improvements in generalized anxiety disorder following mindfulness training.Neuroimage Clin.2013244845824179799
ChaJ.CarlsonJM.DedoraDJ.GreenbergT.ProudfitGH.Mujica-ParodiLR.Hyper-reactive human ventral tegmental area and aberrant mesocorticolimbic connectivity in overgeneralization of fear in generalized anxiety disorder.J Neurosci.201434175855586024760845
FonzoGA.RamsawhHJ.FlaganTM.et alCognitive-behavioral therapy for generalized anxiety disorder is associated with attenuation of limbic activation to threat-related facial emotions.J Affect Disord.2014169768525171782
RobinsonOJ.KrimskyM.LiebermanL.AllenP.VytalK.GrillonC.Towards a mechanistic understanding of pathological anxiety: the dorsal medial prefrontal-amygdala 'aversive amplification' circuit in un-medicated generalized and social anxiety disorders.Lancet Psychiatry.20141429430225722962
AndreescuC.SheuLK.TudorascuD.et alEmotion reactivity and regulation in late-life generalized anxiety disorder: functional connectivity at baseline and post-treatment.Am J Geriatr Psychiatry.201523220021424996397
FonzoGA.RamsawhHJ.FlaganTM.et alCommon and disorder-specific neural responses to emotional faces in generalised anxiety, social anxiety and panic disorders.Br J Psychiatry.2015206320621525573399
MakovacE.MeetenF.WatsonDR.et alAlterations in amygdala-prefrontal functional connectivity account for excessive worry and autonomic dysregulation in generalized anxiety disorder.Biol Psychiatry.2016801078679526682467
MohlmanJ.EldrethDA.PriceRB.StaplesAM.HansonC.Prefrontal-limbic connectivity during worry in older adults with generalized anxiety disorder.Aging Ment Health.201721442643826566020
BuffC.BrinkmannL.NeumeisterP.et alSpecifically altered brain responses to threat in generalized anxiety disorder relative to social anxiety disorder and panic disorder.Neuroimage Clin.20161269870627761400
KarimH.TudorascuDL.AizensteinH.WalkerS.GoodR.AndreescuC.Emotion reactivity and cerebrovascular burden in late-life GAD: a neuroimaging study.Am J Geriatr Psychiatry.2016211110401050
OttavianiC.WatsonDR.MeetenF.MakovacE.GarfinkelSN.CritchleyHD.Neurobiological substrates of cognitive rigidity and autonomic inflexibility in generalized anxiety disorder.Biol Psychol.2016119314127345596