
Figures & data
Table 1 Basic characteristics of the study population by country and sex
Table 2 Comparing prevalence (%) of respiratory symptoms between countries, in the total study population and stratified by sex
Table 3 Respiratory symptoms and number of respiratory symptomsa in relation to health care consumption in the general population analyzed by multiple logistic regression analyses expressed as odds ratio (OR) with 95% CI, adjusted for country, sex, age, BMI, smoking status
Table 4 Comparing health care consumption (%) among subjects with any respiratory symptoms during the past 12 months between countries, in the total study population and by sex
Table 5 Risk factors associated with health care consumptions assessed as outpatient care during the past 12 months expressed as odds ratio (OR) with 95% CI, analysed by multiple logistic regression analyses in the total study population and stratified by country
Fig. 1 The impact of respiratory symptoms on everyday life among subjects with any respiratory symptoms during the past 12 months based on Mantel–Haenszel test for trends.
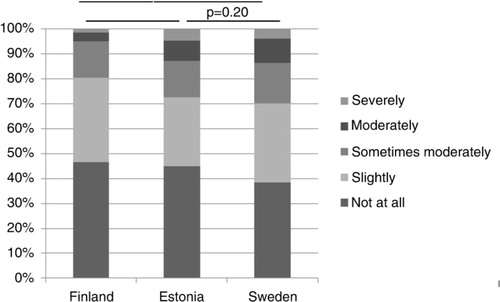
Fig. 2 The impact of respiratory symptoms on everyday life among males and females with any respiratory symptoms during the past 12 months based on Mantel–Haenszel test for trends.
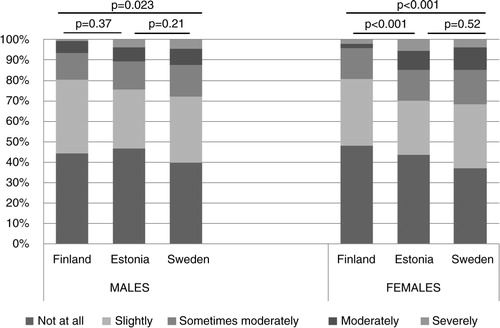
Table 6 Respiratory symptoms and number of respiratory symptoms in relation to experienced impact, moderately to severely, on everyday life analysed by unadjusted logistic regressions and multiple regression models expressed as odds ratio (OR) with 95% CI, adjusted for country, sex, age, BMI, and smoking status