
Figures & data
Fig. 1 Study design. Overview of the single-blind placebo run-in period and double-blind cross-over study periods 1 and 2 (upper section). Overview of study assessments (lower section). Time zero is time of first study medication dosing. The single-blind placebo run-in screening period and the subsequent study periods 1 and 2 were identical. IS: induced sputum.
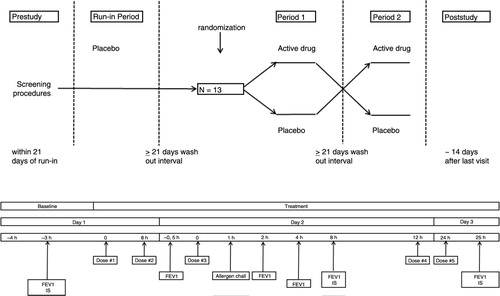
Table 1 Treatment allocation and sample quality results
Fig. 2 Hierarchal cluster assessment for reproducibility of sputum microarray data. Analysis included only subjects for which the baseline specimens at period 1 and 2 were available. Numbers refer to subject numbers. Log 10 ratios of intensity estimates versus the average of all intensities are displayed. Magenta colour refers to probe sets that are up-regulated in reference to the pool of all specimens analysed and cyan to the probe sets that are down-regulated. Blue rectangles link specimens from the same subject that co-cluster on the dendrogram.
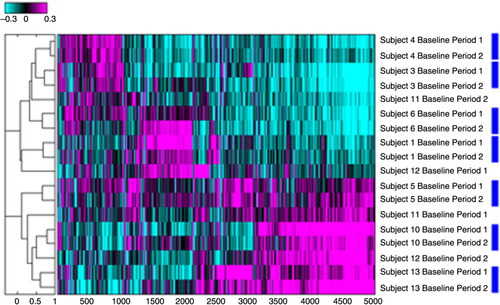
Fig. 3 Log 10 estimates of gene expression changes for the significant genes identified from contrast analysis at 7 hours and 24 hours with an FDR < 0.025. ACE: allergen challenge effect, estimates of changes from baseline in the placebo group. FTE: fluticasone effect, estimates of differences in change from baseline between the placebo and the fluticasone groups.
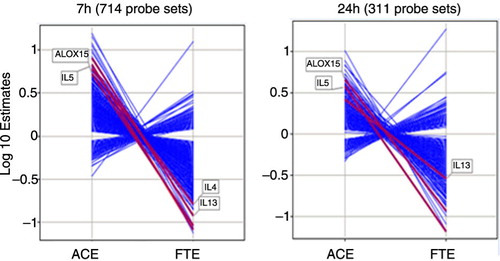
Fig. 4 Fold change from baseline in gene expression. Th2 mRNA levels (IL4, IL5, IL13), Th1 mRNA levels (IFNG and TNF), Th17 mRNA levels (IL22, IL26). Fold change from baseline for the placebo group is represented in red. Fold change from baseline for the fluticasone group is represented in blue. p Values are adjusted p values; error bars represent 90% confidence intervals.
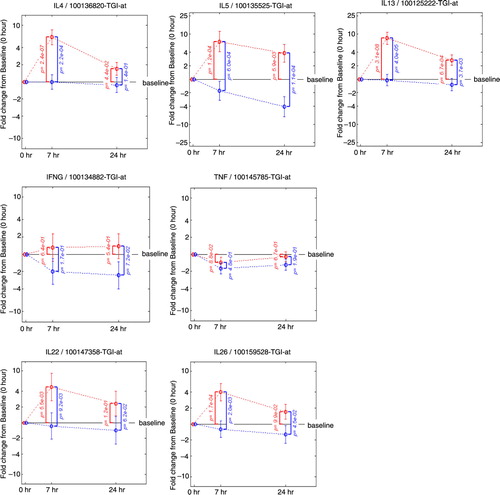
Fig. 5 Fold change from baseline in gene expression. Inflammatory chemokines (CCL13, CCL17, CCL26), molecules controlling the release of histamine (HDC, HRH4, FCER1A) prostaglandins and leukotrienes (PTGER3, ALOX15, GGT5). Fold change from baseline for the placebo group is represented in red. Fold change from baseline for the fluticasone group is represented in blue. p Values are adjusted p values; error bars represent 90% confidence intervals.
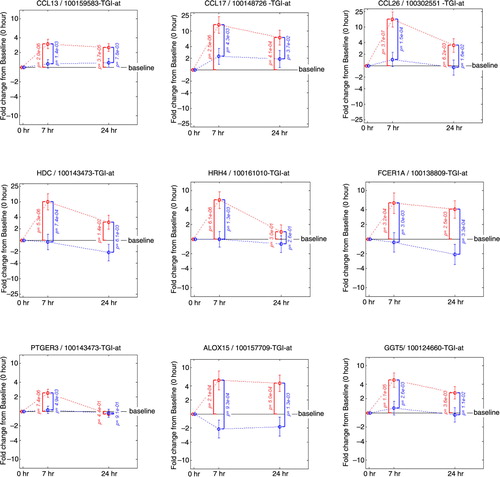
Fig. 6 Fold changes over baseline (point estimate and 90% confidence intervals) for the 47 RNA signatures. Red bars represent the change from baseline in the placebo group and blue bars in the fluticasone group. p Values for the allergen challenge effect (ACE) and the fluticasone treatment effect (FTE) are represented in red on the right hand side and in black on the left hand side, respectively. P1: mRNA levels for Th2 cytokines; P2: chemokines and chemokine receptors; P3: FCERI and histamine signalling; P4: enzymes and signalling molecules in prostaglandin, leukotriene pathways; P5: other mRNA levels for cytokines, growth factors and their receptors; P6: other enzymes; P7: membrane-bound glycoproteins; P8: transcription factors; P9: regulators of the inflammatory response.
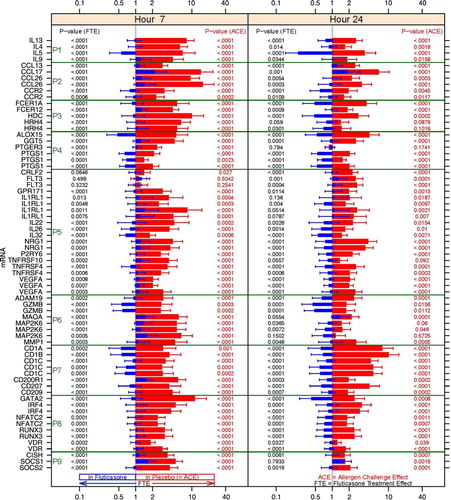
Table 2 Change from baseline in the placebo and the prednisone group for the 47 RNA signatures
Fig. 7 Correlation plots of the most significant probe sets to individual subject clinical measurements (sputum eosinophils and pulmonary lung function tests) for the allergen challenge effect and the FP treatment effect. Correlation coefficients and corresponding p values in parenthesis are listed in purple. HRH4: histamine receptor 4; IL1RL1: IL33 receptor; NRG1: neuregulin 1.
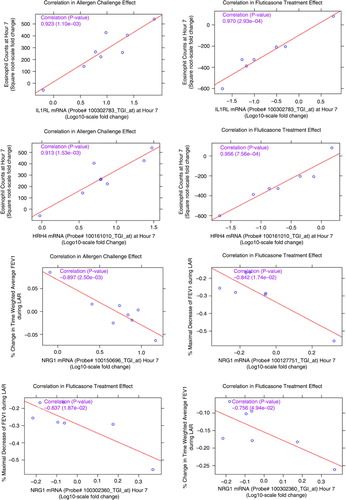
Table 3 Correlations between gene expression measurements from the 47 RNA signatures and various FEV1 measurements
Table 4 Correlations between the gene expression measurements from the 47 RNA signatures and eosinophils (cell counts and percentages)