
Figures & data
Fig. 1 Flow chart showing the number of patients included in final analysis and the results of echocardiography in the respective subgroups, ILD, interstitial lung disease; Echo, echocardiography; PH, pulmonary hypertension; EF, left ventricular ejection fraction.
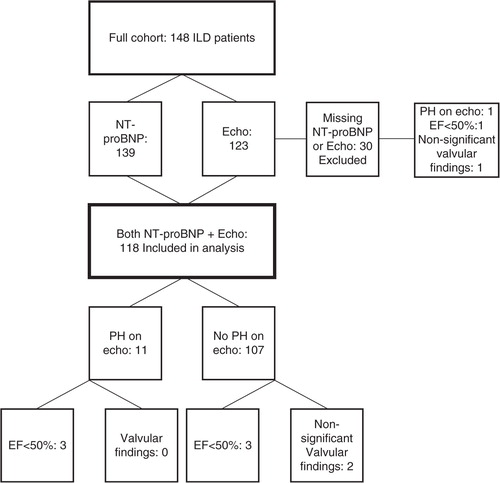
Fig. 2 The values of NT-proBNP in patients with and without PH (pulmonary hypertension) on echocardiography. The vertical line at 95 ng/l. Error bars represent the median and interquartile range. p=0.0003.
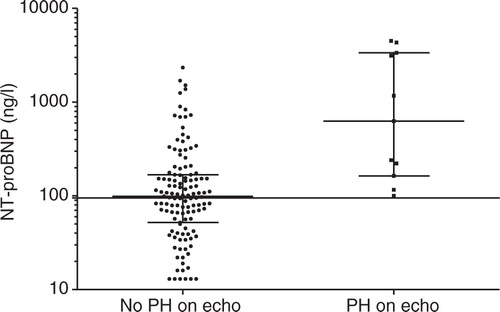
Table 1 Diagnoses and comorbidity in the full cohort and the 118 patients included in the final analysis
Table 2 Demographics, lung function parameters, 6-min walk test and NT-proBNP