
Figures & data
Fig. 1 In the study period 160 patients with pulmonary nodules were randomly assigned to either MusiCure or as control group. Nine patients dropped out after randomisation, leaving 78 participants to receive MusiCure and 73 patients in the control group.
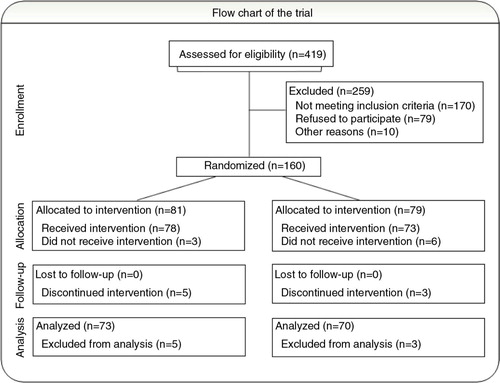
Table 1 Comparison of STAI scores
Table 2 Spielberger's State-Trait Anxiety Inventory (STAI) post- and pre-differences
Table 3 Linear model of predictors of STAI-State immediately before bronchoscopy, with 95% bias corrected and accelerated confidence intervals reported in parentheses
Fig. 2 Patients’ overall perception of the sounds in connection with the procedure. The horizontal lines represent the median within the group.
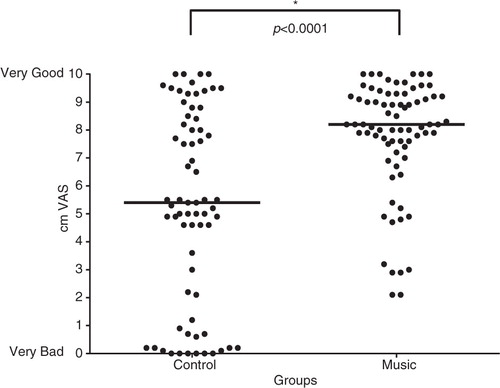
Table 4 Baseline characteristics