
Figures & data
Table 1. Correlation coefficients for WMC-, CTAS-, SelfReg-, and Math-total scores
Table 2. Descriptive statistics for WMC-, CTAS-, SelfReg-, and Math-total scores
Table 3. Demographic statistics in proportion for participating schools
Table 4. Frequencies and proportion of High- (H) and Low- (L) Math, WMC, TA, and SR
Figure 1 Columns: frequencies for designated sets of ‘At-risk’-, ‘In-vigour’-, ‘None’-, and ‘Mixed’ status; in High Maths scores-, Average Maths scores-, and Low Maths scores-groups, respectively (x-axis).
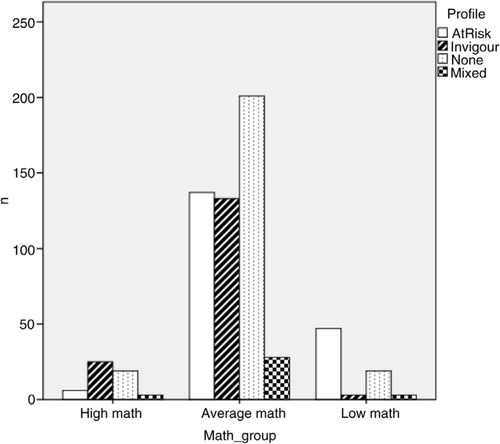
Table 5. Frequencies and clusters of High (H)- and Low (L) wmc, ta, and sr, in total and allocated between High- and Low math, respectively, designated as ‘At-risk’-, ‘Mixed’-, ‘In-vigour’-, and ‘None’-status groups. Sets of combinations of +1 sd. above mean score (H) and -1 sd. under mean score (L), respectively, encompassing TA, SR, and WMC, in +/− 1 sd. above/under mean math scores, respectively. Rows; status-group including: three variables – dark grey coloured; two variables – grey coloured; one variable – white coloured