Figures & data
Table 1a. Examples of direct indicators used in the Project Argus Model for use of media and public domain Internet sources
Table 1b. Examples of indirect indicators used by the Project Argus Biosurveillance System for use of media and public domain Internet sources
Table 2. Project Argus Plant Staging Model
Table 3. Summary of the search results for a case study of brown planthopper and rice grassy stunt or rice ragged stunt in rice in Vietnam and China in 2006–2007
Table 4. Sources and indicators referenced in open source planthopper-virus case study in Vietnam, 2006–2007*
Table 5. Sources and indicators referenced in open source planthopper-virus case study in China, 2007*
Table 6. Summary of direct and indirect indicators obtained from public domain Internet sources for the relationship between ducks and Highly Pathogenic Avian Influenza (HPAI H5N1) epidemic in Vietnam, 2006–2007*
Fig. 1. Comparison of dates of Internet media reports and reports from official sources. Data above the diagonal line correspond to the case when a public domain source reports on an event before an official source reports on the same event. Below the line, an official source reports on an event before a public domain source.
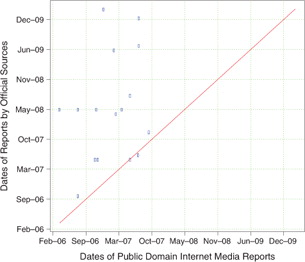
Table 7. Validation of public domain Internet media reports by official reports
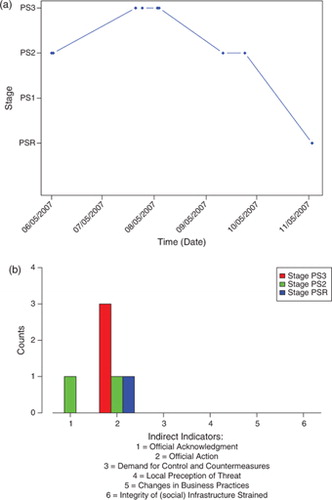
Fig. 2. (a) Stage over time for the 2006–2007 case study of planthopper-virus in Vietnam. (b) Frequency of indirect indicators by stage for the 2006–2007 case study of planthopper-virus in Vietnam.
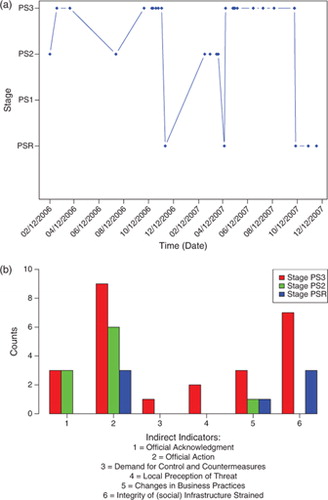
Fig. 3. (a) Stage over time for the 2007 case study of planthopper-virus in China. (b) Frequency of indirect indicators by stage for the 2007 case study of planthopper-virus in China.