Figures & data
Fig. 1 Time series by disease and feed for top diseases by number of events in the HealthMap database. Note: influenza includes both untyped influenza and ‘swine flu’ H1N1 events.
Number of HealthMap Alerts by Disease, July 2008–July 2011.
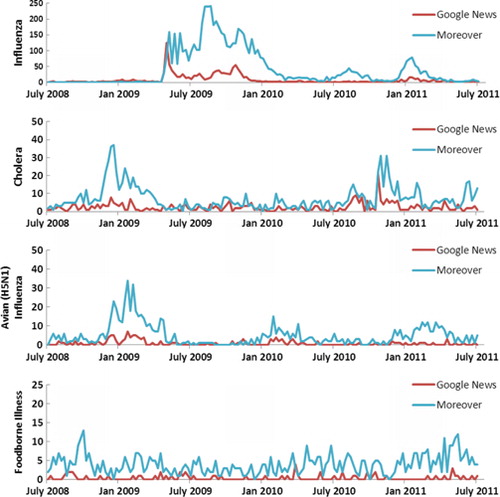
Fig. 2 Breaking disease1 alerts by week over the study period.
1. The following diseases are excluded from this series: influeza influenza/H1N1, cholera, avian influenza and foodborne illness.
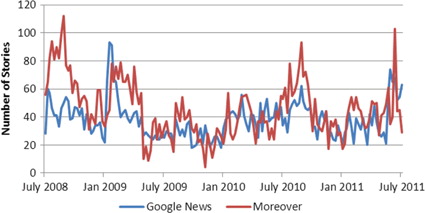
Fig. 3 Natural log of the number of HealthMap alerts by day of the week.
Note: the rectangle marks 25th and 75th percentile distributions; the middle line is the median; whiskers mark the upper adjacent line (which represents 1.5 times the interquartile range); the dots represent extreme values and outliers.
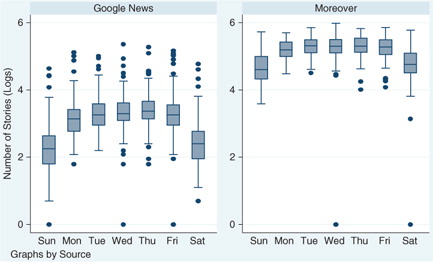
Table 1. The influence of day of the week on log of total disease alerts*
Table 2. The influence of holidays on log of total disease-related events by source (2008–2011)*
Table 3. Measurement of crowd out effect based on OLS specification (with Newey–West standard errors) for Google News and Moreover