Figures & data
Figure 1. Saturated model containing all possible pathways. T1 = acute period (M = 6.1 days postinjury, SD=6.23); T2 = 3 months postinjury; T3 = 12 months postinjury). Bold lines represent direct effects from time one to time three variables.
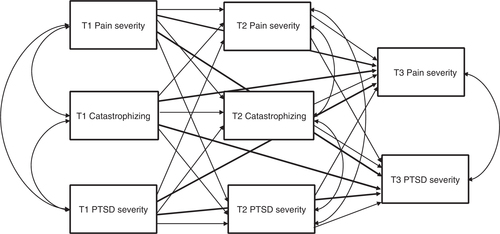
Table 1. Mean PTSD, pain and catastrophizing severity scores (n=208)
Table 2. Correlation matrix of variables included in path analysis
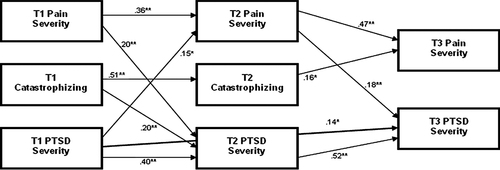
Figure 2. Final model following backward elimination of non-significant pathways. N=208. The figure displays standardized path coefficients between measures of PTSD, catastrophizing and pain severity. T1 = acute (M = 6.1 days postinjury, SD=6.23); T2 = 3 months postinjury; T3 = 12 months postinjury. Bold line represents direct effects from T1 to T3 variables. All correlations (not shown) were significant (T1 PTSD severity–T1 catastrophizing, β=.28**; T1 PTSD severity–T1 pain severity, β=.24**; T1 catastrophizing–T1 pain severity, β=.27**; T2 PTSD severity–T2 catastrophizing, β=.28**; T2 PTSD severity–T2 pain severity, β=.18*; T2 catastrophizing–T2 pain severity, β=.22**; T3 PTSD severity–T3 pain severity, β=.17**). p<.05; **p<.01