Figures & data
Table 1. Mean (M) and standard deviations (SD) of demographics and clinical characteristics per CEM group
Table 2. Classifications of the positive and negative autobiographical memories
Figure 1. Mean and standard error of IES avoidance level per group. *p < 0.05, #p < 0.10.
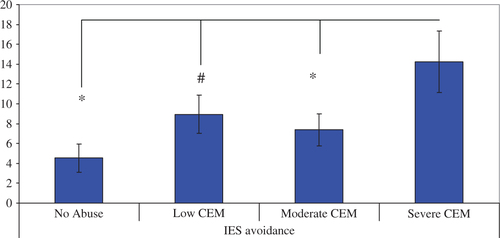
Figure 2. Mean and standard errors of self-reported intrusions of the positive and negative autobiographical memory in the Suppression (S) and Expression (E) phase in the No Abuse, Low CEM, Moderate CEM, and Severe CEM groups, #p < 0.10.
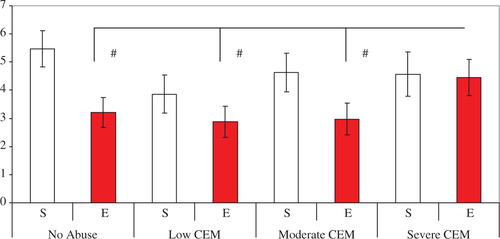
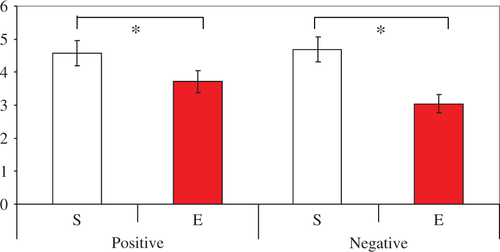
Figure 3. Mean and standard errors of self-reported intrusions of the positive and negative autobiographical memory in the Suppression (S) and Expression (E) phase, *p < 0.05.
Supplemental material