Figures & data
Table 1. Summary of sex differences in PTAs, PTEs, PTSD, and depression
Table 2. Most frequent types of PTAs in the past year
Fig. 1. Theoretical model of a mediation equation. This model is a modified version of the model by Kenny (Citation2012) (Reproduced with permission from David A. Kenny).

Fig. 2. Mediation analysis on the relationship between exposure to PTAs and PTSD. Summary of an analysis of the mediating effect of depressive symptoms on the relationship between exposure to PTAs and PTSD symptoms. C represents the predictive value of PTAs on PTSD before including depression into the equation; C’ the value after including depression.
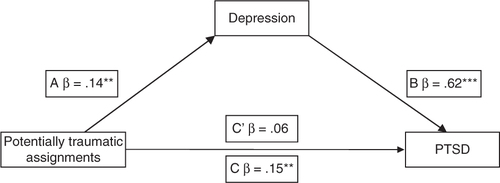
Table 3. Summary of an analysis of the mediating effect of depression between exposure to PTAs and PTSD, controlling for sex (n=352)
Fig. 3. Mediation analysis on the relationship between exposure to personal life PTEs and PTSD. Summary of an analysis of the mediating effect of depressive symptoms on the relationship between exposure to PTEs in personal life and PTSD symptoms. C represents the predictive value of PTEs on PTSD before including depression into the equation; C’ the value after including depression.
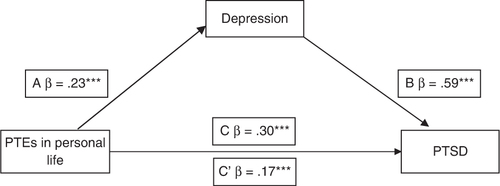
Table 4. Summary of an analysis of the mediating effect of depression between exposure to PTEs in personal life and PTSD, controlling for sex (n=352)