
Figures & data
Fig. 1 Participation of the Kauhajoki Educational Centre in the study after the school-shooting incident, flow chart.
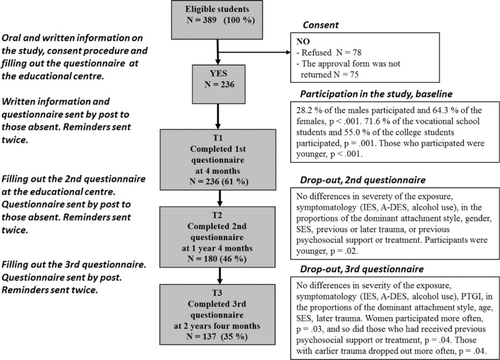
Table 1 Sociodemographic and clinical characteristics of the students at the Kauhajoki Educational Centre participating in the study
Table 2 Sum scores of the Attachment Style Questionnaire (ASQ) by predominant attachment style clusters
Table 3 Means and standard deviations (SD) of Impact of Event Scale (IES), Adolescent Dissociative Experiences Scale (A-DES), and Posttraumatic Growth Inventory (PTGI) in the different attachment style groups at 4 months (T1), 16 months (T2), and 28 months (T3) and ANOVA statistics for attachment effects with post hoc analyses to conclude which of the groups differ from each other
Table 4 Multivariate regression for the posttraumatic symptoms measured by the Impact of Event Scale (IES) studying the effects of avoidant and preoccupied attachment styles compared to secure attachment on recovering from a school-shooting trauma