
Figures & data
Table 1 The KIVS scores grouped into three levels of exposure
Fig. 1 Number of individuals with exposure to interpersonal violence in childhood, among women with borderline personality disorder.
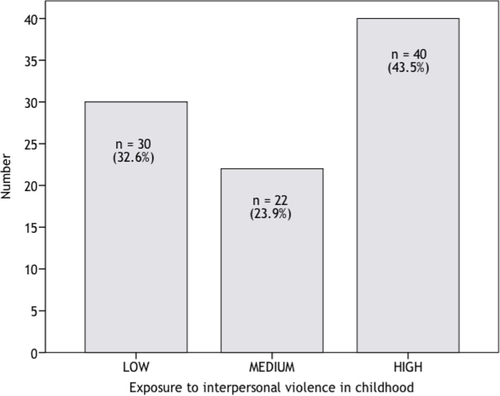
Table 2 Clinical characteristics of the three KIVS groups
Fig. 2 FT3/FT4 ratio in female BPD patients with low, medium high, and high levels of exposure to interpersonal violence as a child.
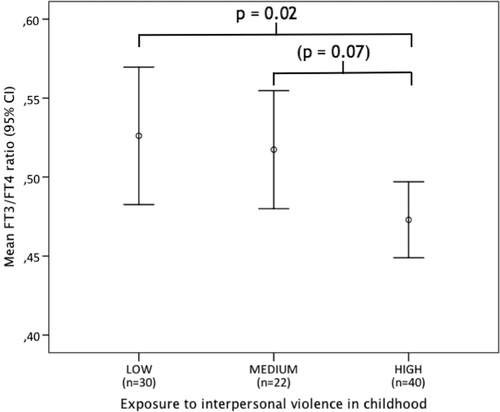
Fig. 3 Correlation between FT3 (pmol/L) and FT4 (pmol/L) in the three groups of KIVS exposure to interpersonal violence as a child.
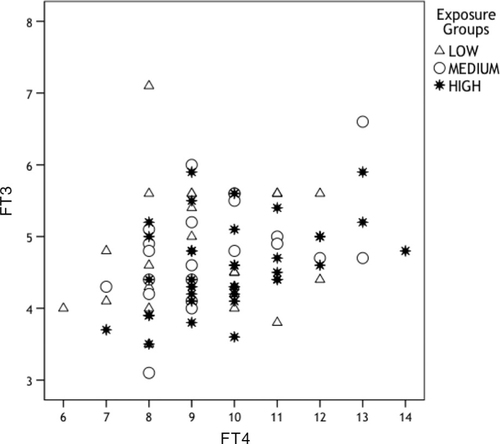
Table 3 Correlation matrix and results of the multiple regression analysis for KIVS exposure to interpersonal violence in childhood and FT3/FT4 in female patients with borderline personality disorder
Fig. 4 Correlation between KIVS exposure to interpersonal violence as a child and FT3/FT4 ratio, in patients with comorbid PTSD.
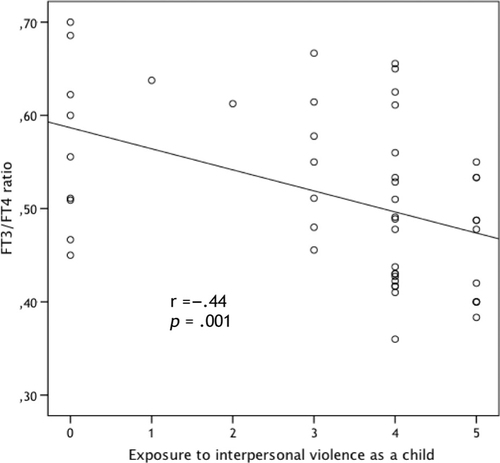
Table 4 Group comparisons (Wilcoxon and t-test) of hormone levels in female borderline patients with and without comorbid PTSD diagnosis