Figures & data
Fig. 1 Schematic for a network approach to disease understanding and drug discovery. To understand conditions such as PTSD, we must link the molecular biology of such conditions to the pathophysiology of the condition (Schadt, Citation2009; Schadt et al., Citation2009). Integrating diverse, large-scale data provides a path to construct predictive network models of disease that in turn can inform on novel therapeutics. Here, panomic, clinical (which includes information on environmental exposures and social factors), imaging, and literature data are integrated to construct networks that inform on different subtypes of disease, healthy states, and network components associated with toxicity or other adverse events. Predictive models that define networks for a given disease subtype or toxicity can be used to construct gene expression assays that can be screened in a high throughput screening context to assess the effect any given compound has on a specific network in cells relevant to the condition under study. Screening carried out in this way can lead to the rapid identification of compounds that affect disease networks in favorable ways, while simultaneously identifying compounds that hit networks associated with toxicity or other adverse events. In this way, compounds can be identified that target specific subtypes of disease without targeting networks that can lead to toxicity or adverse events.
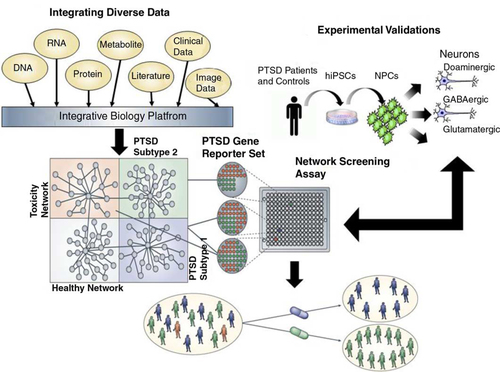
Fig. 2 Dynamic state transitions in PTSD modeled using longitudinal panomic data. System-state trajectories between normal and PTSD-associated states. The x–y axes represent system states as defined by integrative, panomics causal networks associated with PTSD. The z axis represents potential function values that reflect the probability of being in a particular state given a network state. The contours between the normal and PTSD states represent network state transformations defined by targeting a corresponding constellation of genes using a quantitative recipe inferred from the Bayesian networks (i.e., the genes to target including the direction and level of activation or inhibition of each gene or gene product in the recipe).
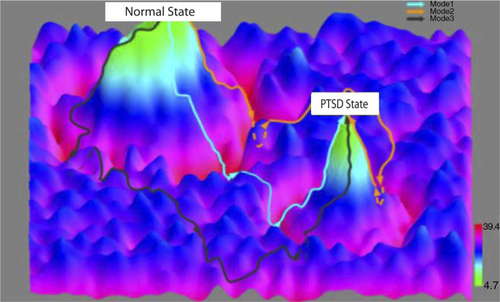
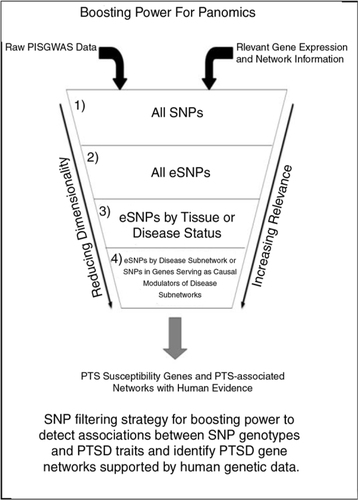
Fig. 3 Boosting power for panomics. SNP filtering strategy for boosting power to detect associations between SNP genotypes and PTSD traits and identify PTSD gene networks supported by human genetic data.