Figures & data
Fig. 1 Descriptive terms used to classify origin of reported pain as somatic, visceral, and/or neuropathic among all study participants.
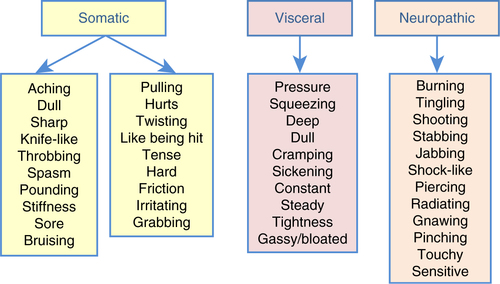
Fig. 2 Consort diagram of the trial population including those screened, enrolled, randomly assigned, completing treatment, and analyzed.
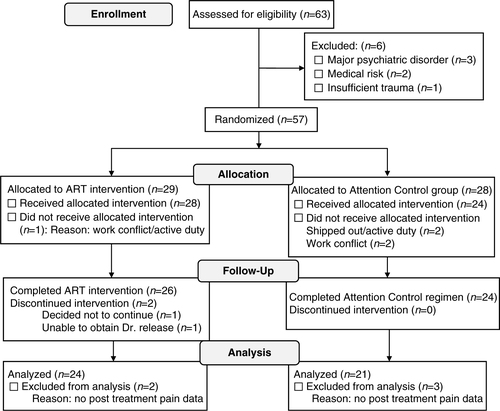
Table 1 Demographic, military, and clinical characteristics by random assignment
Table 2 Frequency and percent of types of injuries and problems reported by service members and veterans (N=45)
Fig. 3 Plot of change scores on the Pain Outcomes Questionnaire (POQ) before and after treatment with Accelerated Resolution Therapy (ART) versus before and after an attention control (AC) regimen. Each vertical line represents the response of an individual service member or veteran. ITT=intention to treat analysis.
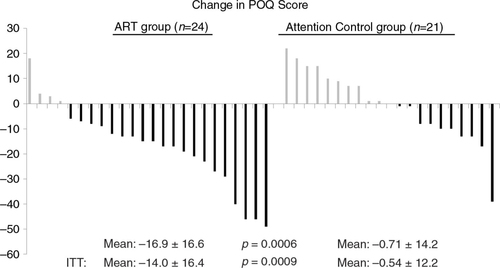
Table 3 Mean pre- to post-assessment differences in POQ scale score by random assignment (all participants)
Table 4 Mean pre- to post-assessment differences in POQ scale score by random assignment (participants with a pain score of four or more at study entry)
Fig. 4 Scatter plot and linear regression line of the relationship between baseline PTSD symptom score from the PCL-M and baseline total pain score from the POQ.
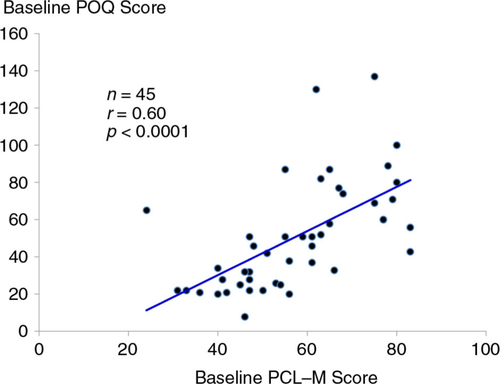
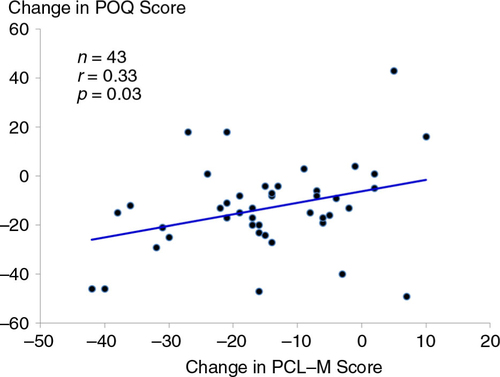
Fig. 5 Scatter plot and linear regression line of the relationship between change in PTSD symptom score from the PCL-M and change in total pain score from the POQ before and after treatment with Accelerated Resolution Therapy (ART).