Figures & data
Table 1 Absolute frequency of trauma endorsed by PDS-F traumatic event [n of respondents (% with reference to the whole sample)]
Fig. 1 Trauma and impulsivity predicting emotion regulation, and mediation by emotion regulation for predicting depressive mood; χ2(6)=7.049, p=0.3164; RMSEA [90% confidence interval]=0.043 [0; 0.147] CFI=0.986; TLI=0.957; N=93. Bold arrows indicate significant standardized regression coefficients (p<0.05). Normal arrows indicate non-significant standardized regression coefficients.
![Fig. 1 Trauma and impulsivity predicting emotion regulation, and mediation by emotion regulation for predicting depressive mood; χ2(6)=7.049, p=0.3164; RMSEA [90% confidence interval]=0.043 [0; 0.147] CFI=0.986; TLI=0.957; N=93. Bold arrows indicate significant standardized regression coefficients (p<0.05). Normal arrows indicate non-significant standardized regression coefficients.](/cms/asset/4073a739-937d-40fd-b23b-2ef2abb19eb3/zept_a_11814729_f0001_ob.jpg)
Table 2 Cronbach's α, means, standard deviations, and Pearson correlations for trauma, UPPS impulsivity facets, emotion regulation, and depressive mood
Fig. 2 Interaction effect between trauma and urgency on appropriate emotion regulation (ER) strategies.
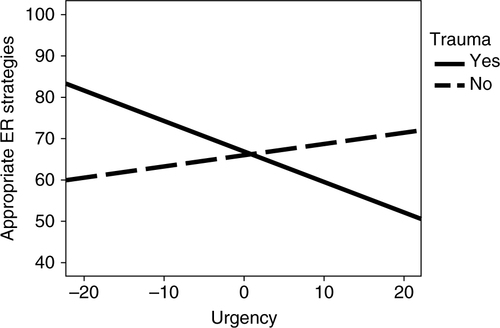
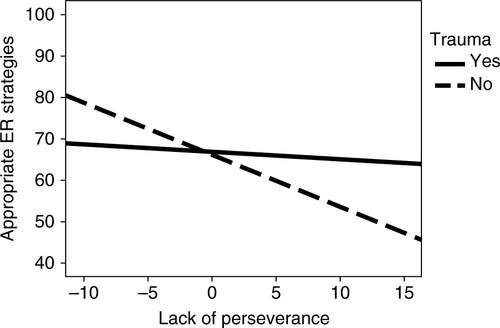
Fig. 3 Interaction effect between trauma and lack of perseverance on appropriate emotion regulation (ER) strategies.