
Figures & data
Table 1 Items representing PTSD and CPTSD
Table 2 Example items from the Trauma Symptom Checklist subscales
Table 3 Frequencies and percentages of symptom endorsement for PTSD and DSO symptoms
Fig. 1 Profile plot of estimates from latent class analysis of complex PTSD symptoms: sudden infant death sample.
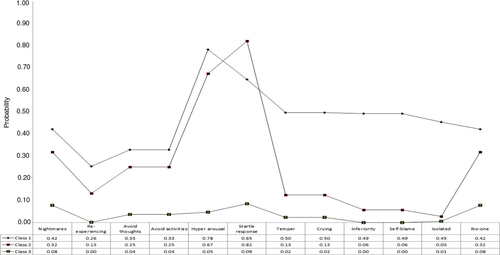
Table 4 Fit statistics for latent class analysis of CPTSD symptoms: bereaved parents sample
Fig. 2 Profile plot of estimates from latent class analysis of complex PTSD symptoms: sexual trauma sample.
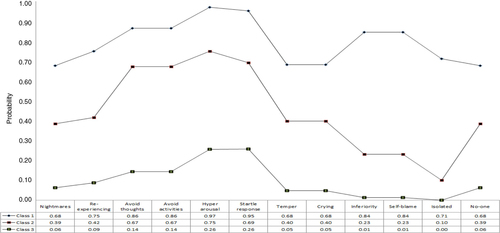
Table 5 Fit Statistics for latent class analysis of complex PTSD symptoms: sexual trauma sample
Fig. 3 Profile plot of estimates from latent class analysis of complex PTSD symptoms: physical assault sample.
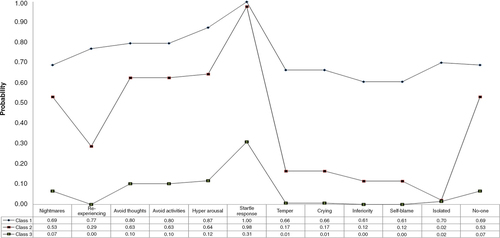
Table 6 Fit statistics for latent class analysis of complex PTSD symptoms: physical assault sample
Table 7 Tests of differences of means of TSC subscales across classes: bereaved parents
Table 8 Tests of differences of means of TSC subscales across classes: sexual trauma victims
Table 9 Tests of differences of means of TSC subscales across classes: physical assault victims