
Figures & data
Table 1 Latent class models and fit indices
Fig. 1 Standardized symptom severity profile by class. For clarity of presentation, the scores depicted in the figure have been standardized.
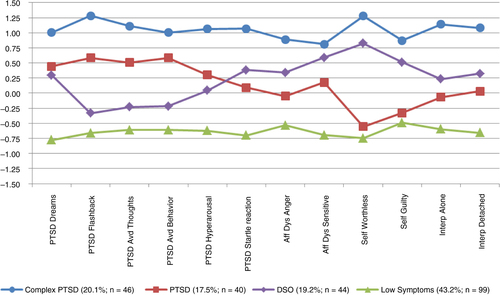
Table 2 Rates of PTSD, CPTSD, and subthreshold CPTSD in all classes
Table 3 Symptom characteristics of the four classes
Supplemental material