Figures & data
Table 1 Assumed survival advantage of the shutdown continuum according to Schauer and Elbert (Citation2010) in order to inhibit non-adaptive action disposition and enable survival
Table 2 Sample description, mean, and standard deviation of age, frequency of gender, and mean and standard deviation of shutdown dissociation
Table 3 Item difficulties and factor loadings in an one-factor solution as well as in a rotated (Varimax) two-factor solution
Table 4 Item-total-correlation as well as retest reliability index on item level
Fig. 1 The relationship between the sum score of the first and second assessments of the shutdown dissociation score. The filled circles present members of the patient group of the study sample 1 (patients with posttraumatic stress disorder and/or major depression) and the open circles members of the healthy control group. The line indicates the regression line (model estimation from the patient sample).
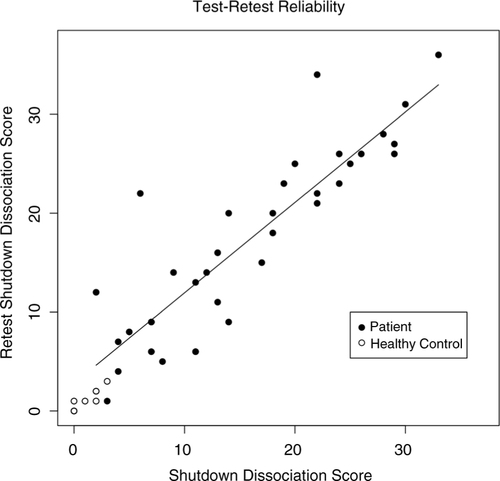
Fig. 2 The relationship between the shutdown dissociation score and the shutdown dissociative strength in response to emotional evocative pictures. The filled circles present a PTSD/MD group and the open circles a non-PTSD group member. The line shows the regression line (model estimation from the patient sample). PTSD=posttraumatic stress disorder, MD=major depression.
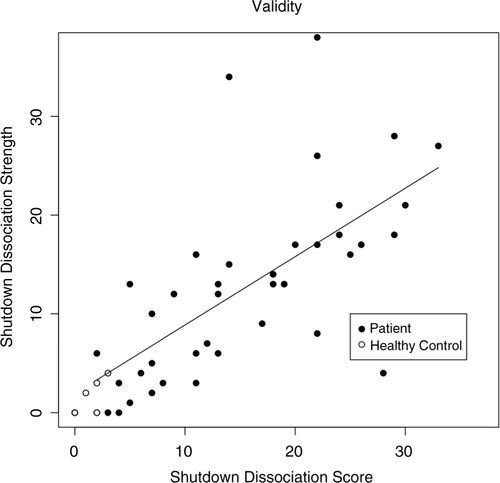
Fig. 3 The scatterplot of the shutdown dissociation sum score and the sum score of the Dissociative Experience Scale (DES) across different diagnostic groups and healthy controls. The patients in the dissociative identity disorder group were instructed to rate the symptoms for the host personality. The dashed horizontal line presents the cut-off score of the DES sum score, and those values above 30 are indicative of a dissociative disorder or of posttraumatic stress disorder (PTSD).
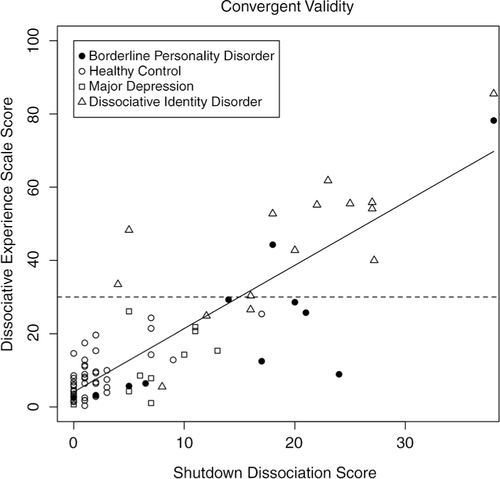
Fig. 4 Boxplot of the shutdown dissociation sum score across different diagnostic groups and healthy controls. The patients in the dissociative identity disorder group were instructed to rate their symptoms for the host personality. BPD=borderline personality disorder, MD=major depression.
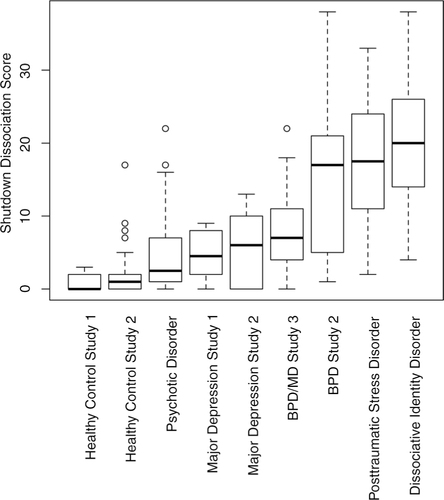
Table 5 Group comparisons between different diagnostic groups as well as healthy controls
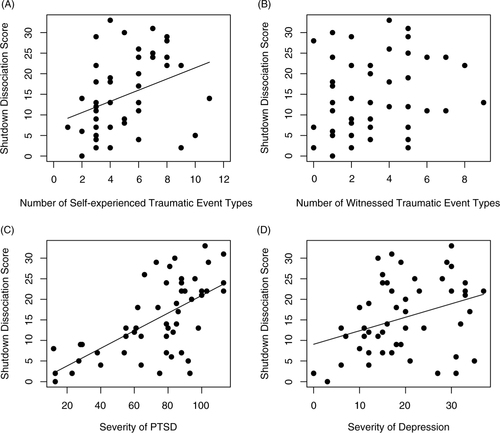
Fig. 5 Scatterplots illustrating correlations between shutdown dissociation and (A) the number of different traumatic event types, (B) the number of different witnessed traumatic event types, (C) the severity of PTSD symptoms, and (D) the severity of depression symptoms. The slope of the regression is presented for significant associations. PTSD=posttraumatic stress disorder.