
Figures & data
Table 1 Descriptive statistics and sex differences in mediators and PTSD severity
Table 2 Correlations between pre-, peri- and posttraumatic risk factors and PTSD severity (Pearson's r)
Fig. 1 Illustration of a multiple mediation model of sex differences in PTSD. Path c represents the total effect. Path c′ represents the direct effect. Paths a + b represent the indirect effect of sex on PTSD through the mediators. The strength of the mediation is the difference between c and c′. Mediation occurs when path c is statistically significant but becomes non-significant after adjusting for the mediators, resulting in a non-significant path c′.
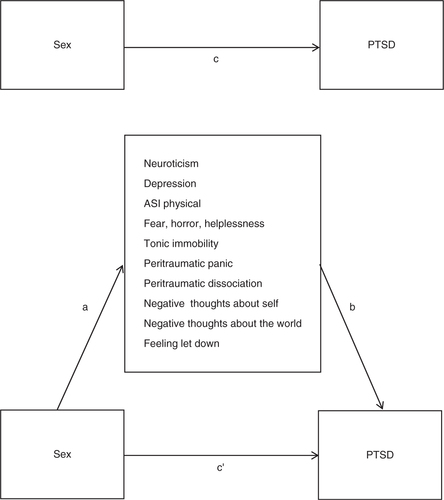
Table 3 Mediation analysis of sex differences in PTSD severity: Indirect effects of sex on PTSD severity through the 10 mediators