
Figures & data
Table 1 Means, standard deviations, composite reliability (CR), AVE, √AVE, and correlations between main study measures
Table 2 Standardized factor loadings for latent variables in the measurement model
Fig. 1 Hypothesized model 1. (See variable names in Table 2).
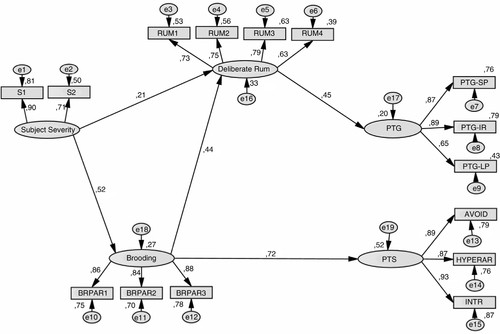
Fig. 2 Alternative model 2 (See variable names in Table 2).
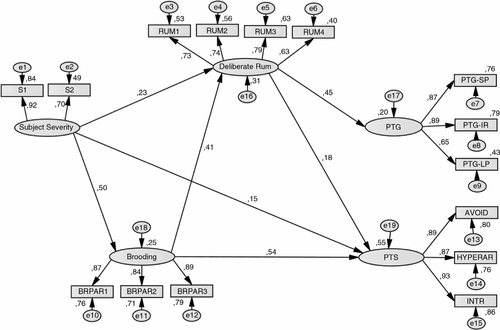
Table 3 Fit indices for model 1 and model 2
Table 4 The standardized indirect effects, the 95% CI for the estimates (lower and upper bound), their standard errors, and p-values
Supplemental material