Figures & data
Fig. 1 Consort diagram showing the flow of participants through each group. Fifteen participants were in the EMDR condition and 14 participants were assigned to wait-list control condition. The control group did not receive any pharmacological or psychological treatment while the EMDR group received a maximum of seven sessions of treatment (mean=4, 13).
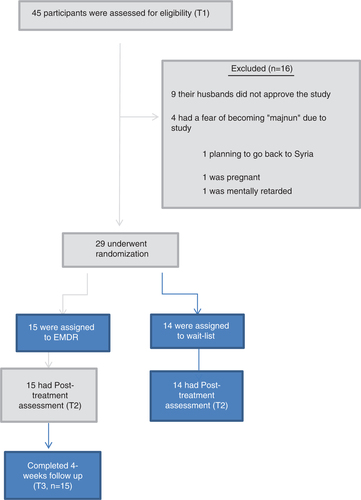
Table 1 Sociodemographic and migration related characteristics of the sample
Table 2 Means and standard deviations for IES-R and BDI-II scores
Table 3 Statistical comparisons across time and groups
Fig. 2 Change in the EMDR and the wait-listed groups’ Impact of Event Scores with Standard error bars across time.
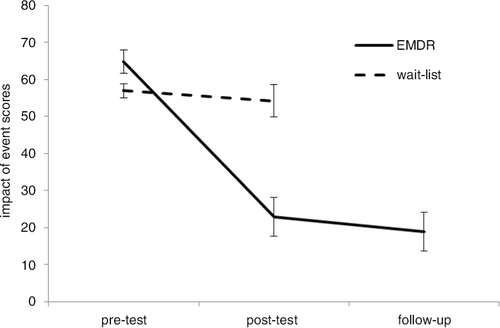
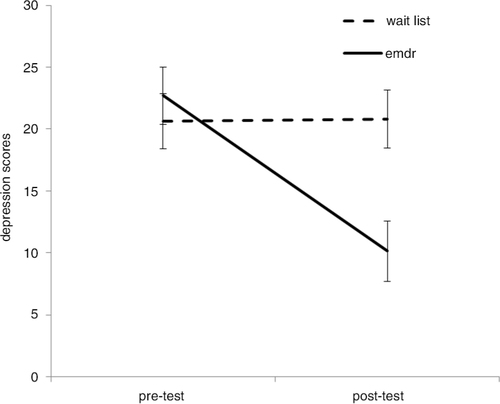
Fig. 3 EMDR and wait-listed groups’ depression scores with standard error bars as a function of time.