
Figures & data
Table 1 Adolescent and therapist ratings of the alliance across treatment conditions
Fig. 1 Divergence of therapists’ and adolescents’ alliance ratings. Diagonal thick line=no divergence between therapist and adolescent ratings; diagonal thin line=regression line; dashed horizontal line=mean therapist ratings; and dashed vertical line=mean adolescent rating.
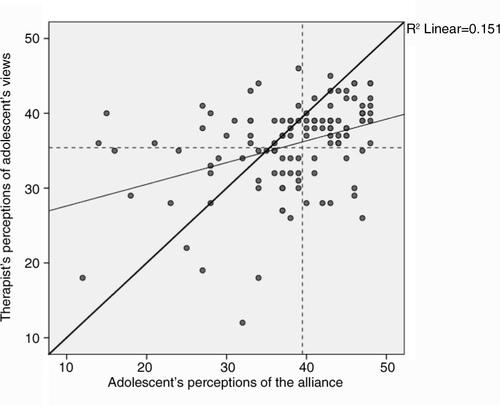
Table 2 Linear regressions with adolescent and therapist alliance ratings and outcome
Table 3 Correlations between alliance scales and outcome measures
Table 4 Factor loadings for exploratory factor analyses with geomin rotation for adolescent and therapist TASC-r scales
Table 5 Linear regressions for therapist—adolescent discrepancy and outcome
Supplemental material