Figures & data
Table 1 Demographic and clinical information by diagnostic group
Fig. 1 Test–retest reliability of trauma exposure assessed as the number of different traumatic event types experienced (left) and assessed as the experienced traumatic events frequency score (right). The line represents the linear relationship (estimated by fitting an ordinary least square regression) between the two repeated measurements across the entire reliability sample.
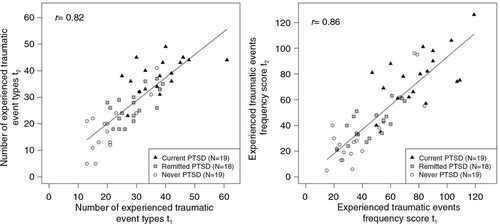
Table 2 Goodness of fit statistics for models including different trauma measures as predictors of lifetime PTSD, current PTSD, and current PTSD symptom severity
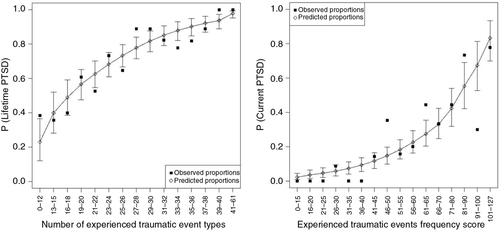
Fig. 2 Left panel: The probability of lifetime PTSD is best predicted by a trauma assessment which measures the number of different traumatic event types experienced. Depicted are the observed and predicted proportions of lifetime PTSD against the number of traumatic event types, with 95% bootstrapped confidence intervals of the prediction. Right panel: By contrast, the probability of current PTSD is best predicted by a trauma assessment which considers the frequency of the traumatic events experienced. Depicted are the observed and predicted proportions of current PTSD against the experienced traumatic events frequency score, with 95% bootstrapped confidence intervals of the prediction. For this graphical illustration, data on trauma exposure was aggregated in groups of ≥9 individuals per group in order to be able to calculate meaningful proportions.