Figures & data
Figure 1. Selection of randomized placebo-controlled trials for meta-analysis.
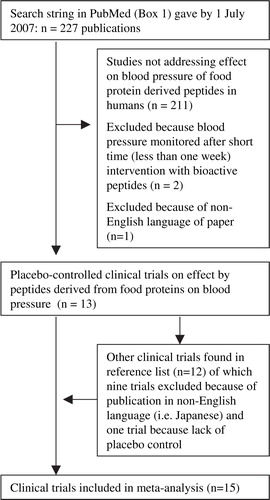
Table 1. Baseline characteristics of clinical trials included for meta-analysis with mean and standard deviation values
Table 2. Daily intervention of bioactive components from different food sources and duration of clinical trials included for meta-analysis
Table 3. Calculating the effect of trials based on within or between subject comparison of intervention and placebo control treatment
Figure 2. Standard forest plot from meta-analysis on systolic blood pressure. Cochran's Q-test for homogeneity was Q=30.52, p-value = 0.02.
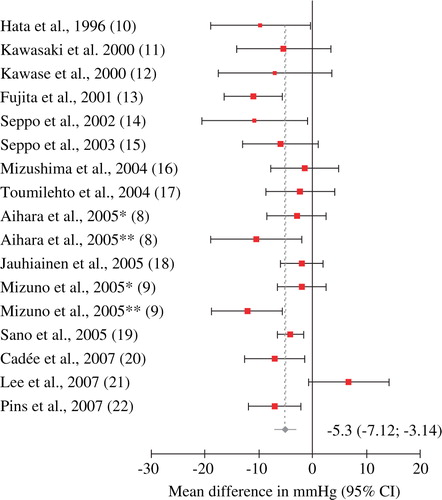
Figure 3. Standard forest plot from meta-analysis on diastolic blood pressure. Cochran's Q-test for homogeneity was Q=29.10, p-value = 0.08.
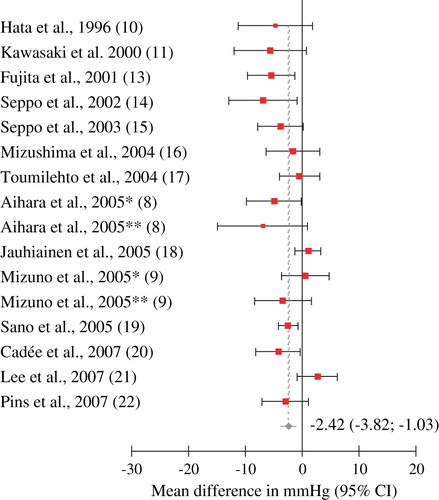
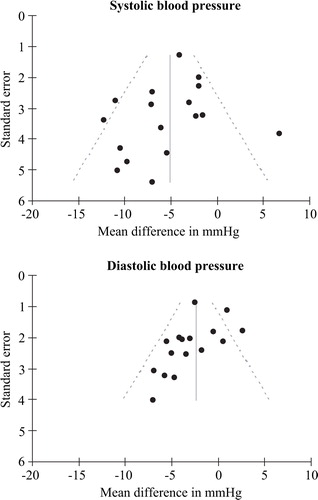
Figure 4. Funnel plots of mean effects on systolic and diastolic blood pressure to detect signs of publication bias.