Figures & data
Table 1. Characteristics of the 12 human male volunteers at baseline
Figure 1. Mean tracer in urine from the single 77Se dose detectable before administration (day 0) of a single oral dose and at day 1, 2, 3, and 14 after tracer administration (Mean±SD; Day 0 to 3: n = 12; Day 14: n = 6).

Figure 2. Mean tracer in faeces from the single 77Se dose as percentage of the total selenium detectable before marker excretion (day 0) and in samples of day 1 – 3, 4 – 5, and day 14 after tracer excretion. The periods were pooled according to the markers taken simultaneous with the single dose. The data are presented as mean values±SD with 12 specimens at day 0 and day 1–3. The data of day 4–5 and day 14 included 9 and 6 specimens, respectively.
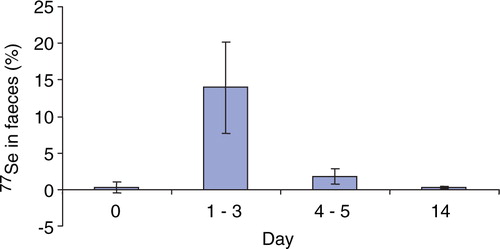
Figure 3. Mean plasma 77Se tracer concentration (µg/L) in 12 human volunteers given a single oral dose of 327 µg 77Se as Selenium yeast together with a light meal after an overnight fast (Mean±SD; n = 12).
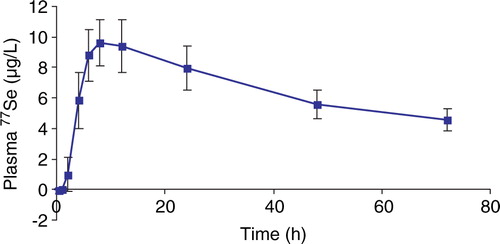
Table 2. Intake, absorption, excretion and retention of 327 µg 77Se administered as a single dose to 12 men with a habitual high intake of Se. The values are based on urinary and faecal excretion from days 1–3 after administration of 77Se. Values are given as median values with 10–90% percentiles and also as means±standard deviation. Values are further given as % of the ingested dose with 10–90% percentiles and also±standard deviation.