Figures & data
Figure 1. The relative risk to sustain a fall. Published study, number of individuals (N), the gender (m = male, f = female), mean age of the cohort (years), duration of the prospective studies (months). The figure presents 95% confidence interval (95% CI) for odds ratio in active compared to inactive individuals.
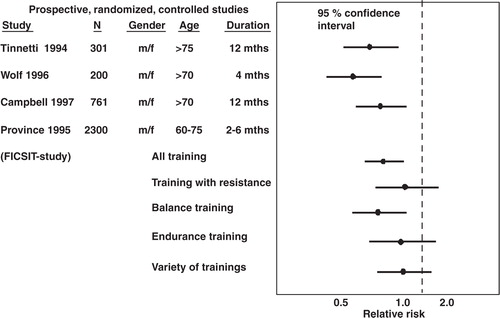
Figure 2. Relative risk of sustaining a hip fracture with a higher level of exercise. Original study, numbers (N), age (years), duration of observation (years) and compared activity levels with 95% confidence interval (95% CI) for the odds ratio presented. A 95% CI below 1.0 indicate that exercise reduces the number of fractures.
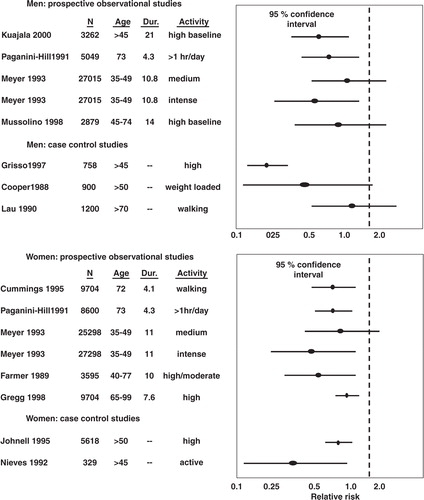
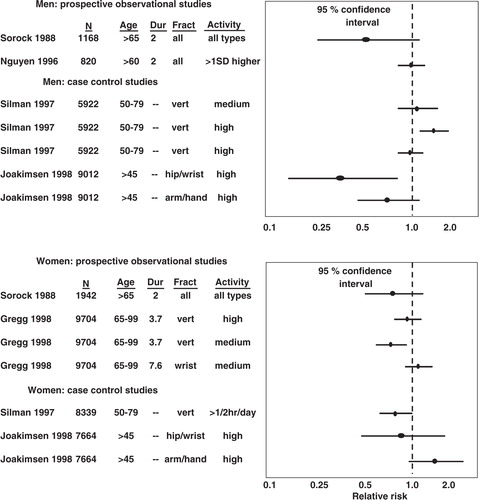
Figure 3. Relative risk of sustaining other fragility fractures with higher level of exercise. Original study, numbers (N), age (years), duration of observation (years) and compared activity levels with 95% confidence interval (95% CI) for the odds ratio presented. A 95% CI below 1.0 indicate that exercise reduce the number of fractures.