Figures & data
Fig. 1. Example of images from the reference material (½ and 1 unit, respectively, of five different vegetable items from two different plate-angles).
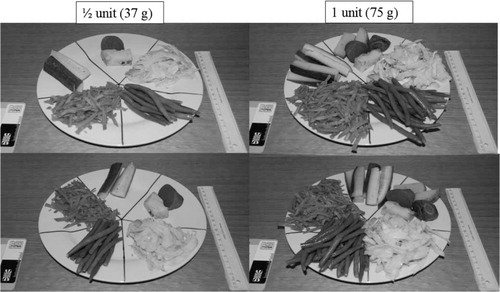
Table 1. ‘Coding tree’ used to analyse interviews about use of the digital method
Table 2. Regression and cross-classification analysis between weights estimated by the digital and by the weighed record methods, respectively, for different food categories (log-transformed and per 10 MJ)
Table 3. Regression and cross-classification analysis between values estimated by the digital and by the weighed record methods, respectively, for total energy intake per meal, energy density, and macronutrient distribution (n = 88)
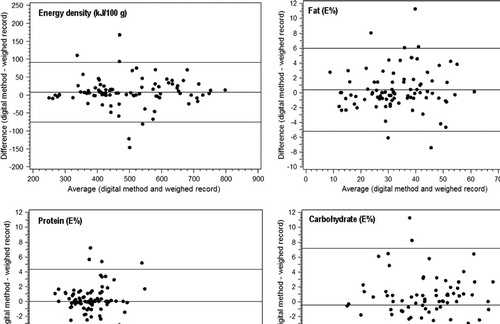
Fig. 2. Bland–Altman plots showing the mean bias (middle line) and limits of agreement (top and bottom lines) between the digital and weighed record methods, respectively, for energy density and macronutrients.