Figures & data
Fig. 1. BMI distribution. A total of 1,032 female parents completed our surveys. BMI distribution in each of the following four categories is indicated: underweight, normal weight, overweight, and obese.
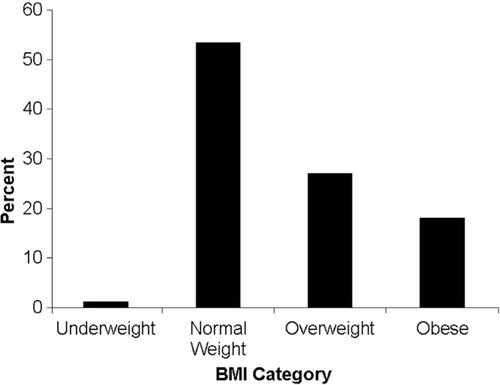
Table 1. Female parents’ demographic characteristics and descriptive statistics (n=1,032)
Table 2. Crosstabulation of parents and children weight status
Fig. 2. Fat intake. A validated rapid screener was used to assess fat intake in a subset of the participants (n=681); *p<0.05.
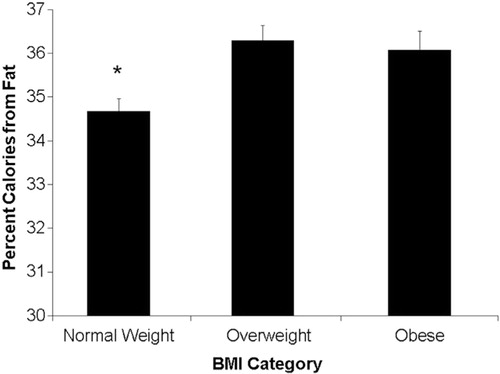
Table 3. Influence of BMI by physical activity, income, social ladder, education, and weight perception as independent variables
Table 4. Pearson correlations (two-tailed for various variables)