Figures & data
Table 1. Carbohydrate composition1 (g/100 g dry matter basis) of sweetpotato- and maize-based complementary foods
Fig. 1. Viscosity during cooking (peak viscosity), at serving (consume viscosity), and during storage (final viscosity) of porridge from the complementary foods.
Bar value (mean±standard deviation, n=3).
Bar with different letter for each variable for complementary foods was significantly different (P<0.0001).
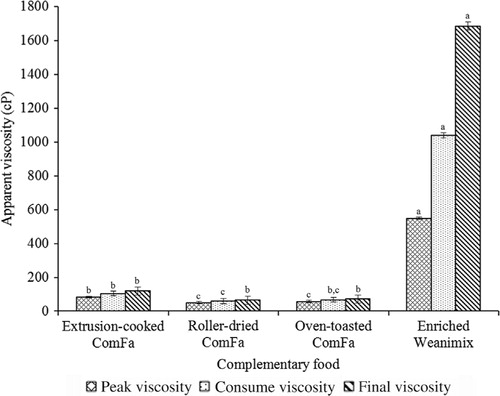
Fig. 2. The water solubility index of the complementary foods.
Bar value (mean±standard deviation, n=3).
Bar with a different letter for each variable was significantly different (P<0.0001).
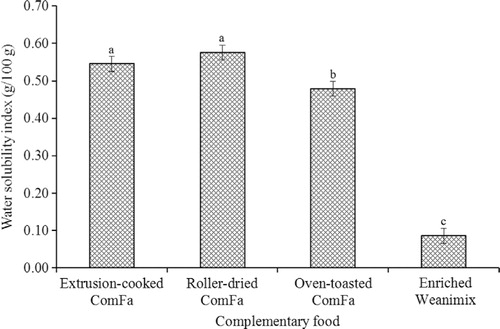
Table 2. Correlation coefficient1 between carbohydrate composition, apparent viscosity, and water solubility index (WSI)
Fig. 3. Diagrammatic presentation of product liking for sensory attributes and choice to give the formulations as complementary food to infants by 20 female sensory participants.
Sensory attribute with P<0.05 indicates that significant difference among the complementary foods; italicised value in parenthesis is asymptotic significance from Kruskal–Wallis test.
A 9-point hedonic scale was used (1 = least acceptable/dislike extremely; 5 = neutral; 9 = highly acceptable/like extremely) for all attributes except for willingness to give product to babies (1 = not likely; 5 = neutral; 9 = very likely).
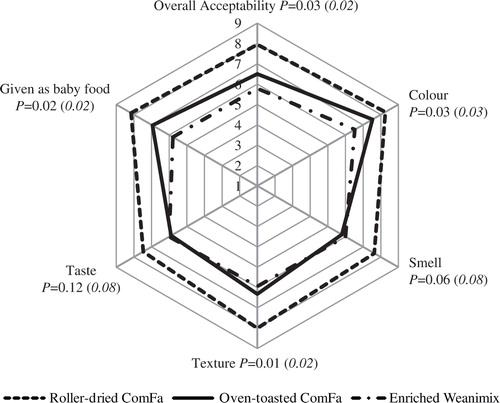
Fig. 4. Diagrammatic presentation scoring for sweetness intensity of the complementary food formulations on just-about-right scale by 20 female sensory participants.
Scoring was done on a 9-point scale, and responses were categorised as ‘much too low’ (≤2), ‘too low’ Citation3 Citation4, just-about-right Citation5, ‘too high’ Citation6 Citation7, and ‘much too high’ (≥8).
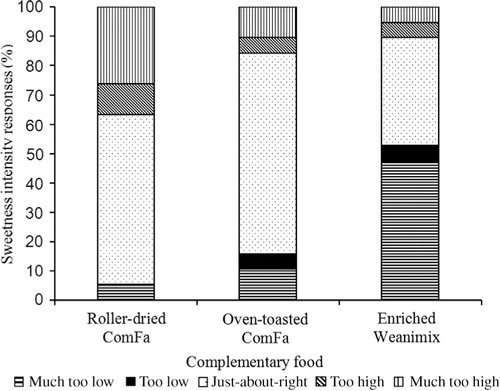
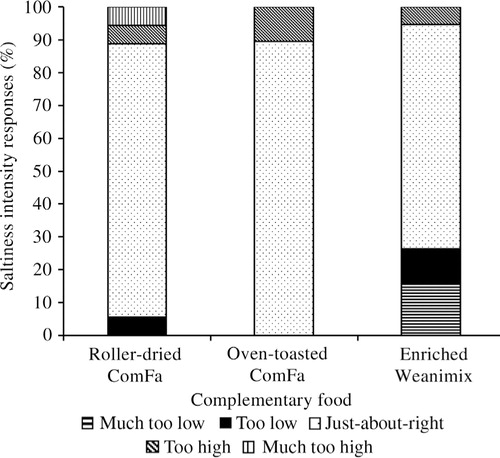
Fig. 5. Diagrammatic presentation scoring for saltiness intensity of the complementary food formulations on just-about-right scale by 20 female sensory participants.
Scoring was done on a 9-point scale, and responses were categorised as ‘much too low’ (≤2), ‘too low’ Citation3 Citation4, just-about-right Citation5, ‘too high’ Citation6 Citation7, and ‘much too high’ (≥8).