Figures & data
Fig. 1. Flow chart of the seafood index.
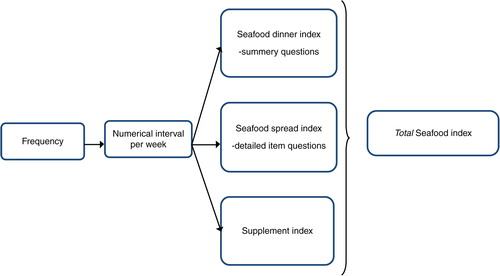
Table 1. The seafood index – conversion of frequencies to numerical values
Table 2. The supplement index – conversion of frequencies to numerical values
Table 3. Frequency estimates from the seafood index
Table 4. Socio-economic and behavioural characteristics of study participants (n=55)
Table 5. Summary statistics for biomarkers in all participants (n=55) and non-supplement users (n=19)
Fig. 2. The figure illustrates the association between the reported seafood for dinner frequency (summary question) and the estimated seafood for dinner frequency (based on seafood index from all dinner items). The sum of points equals 100. The line represents matching frequencies. Spearman's rho between the reported seafood dinner frequency and the estimated seafood dinner frequency was 0.59, with a significance level of P>0.001.
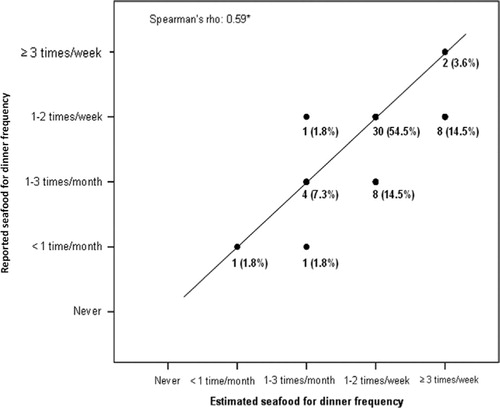
Fig. 3. The figure illustrates the association between the reported seafood as spread frequency (summary question) and the estimated seafood as spread frequency (sum of all seafood as spread items). The sum of points equals 100. The line represents matching frequencies. Spearman's rho between the reported seafood as spread frequency and the estimated seafood as spread frequency was 0.82, with a significance level of P>0.001.
∧The data points could be allocated with the data points below as the estimated seafood as spread frequency was maximum ≥3 times/week.
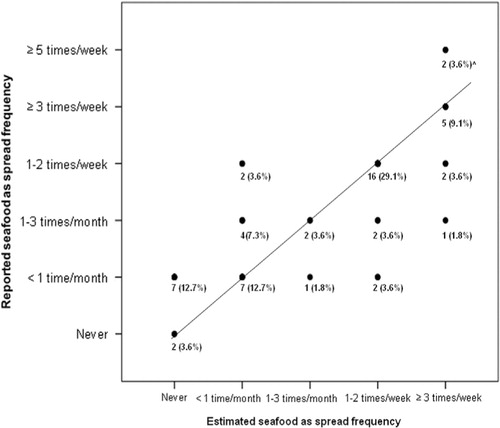
Table 6. Spearman's rho coefficients of the association between the different seafood indexes and biomarkers in all participants, n=54
Fig. 4. The association between the total seafood index (fish, other seafood, and omega-3 supplement intake) and the omega-3 index, in all participants (n=54).
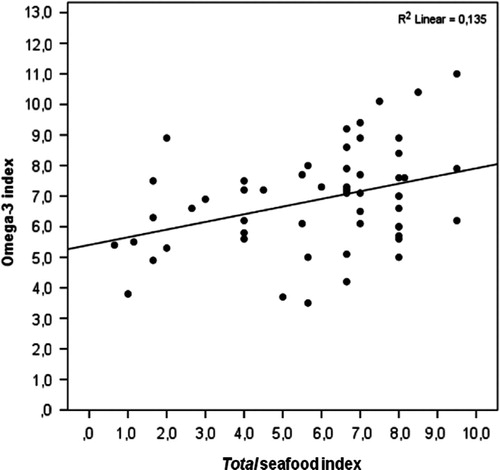
Fig. 5. The association between the total seafood index (fish, other seafood, and omega-3 supplement intake) and the omega-3 HUFA score, in all participants (n=54).
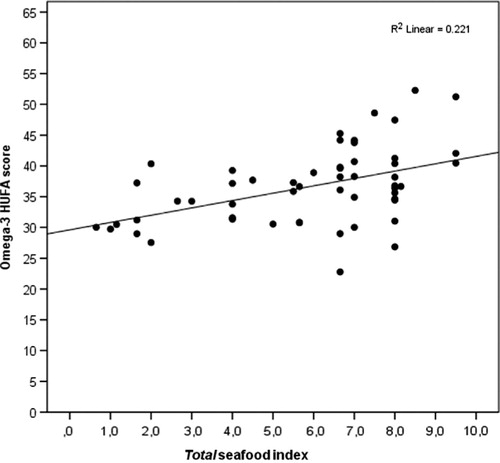
Fig. 6. The association between the total seafood index (fish, other seafood, and omega-3 supplement intake) and serum 25OH vitamin D, in participants who answered in the winter months (October–April) (n=30).
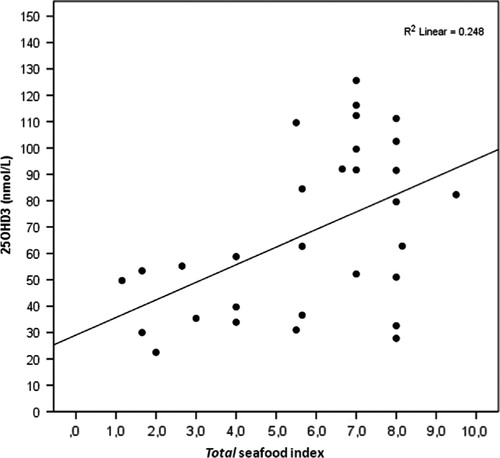
Table 7. Concentrations of biomarkers in all participants according to total seafood index quartiles