
Figures & data
Table 1 Composition of the provided study foods
Table 2 Baseline and 8-week measurements amongst the study population
Table 3 Mean (SD) daily study meat and fish consumed and key nutrient intakes from these foods at week 1 and week 7 of the study
Table 4 Mean (±SEM) percentage concentrations of fatty acids measured in erythrocytes at baseline and after 8-weeks consumption of a CONTROL (n=37) or FISH (n=43) diet
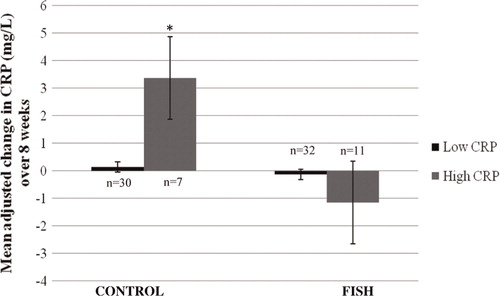
Fig. 1 Mean adjusted changes in CRP over 8-weeks between CONTROL and FISH Group×CRP strata interaction (p=0.017) using the Sidak test for multiple comparisons.
*p=0.046 between high and low CRP in CONTROL.
Supplemental material