Figures & data
Table 1 Characteristics of the study population by living arrangement and diagnosis
Fig. 1 Proportion low- and high-frequency consumers by diagnosis. Intake frequencies are presented as a percentage of the population diagnosed with WS (n=21), DS (n=24) or PWS (n=20).
*p<0.05 when participants with PWS were compared to participants with WS and DS using logistic regression models adjusted for BMI.
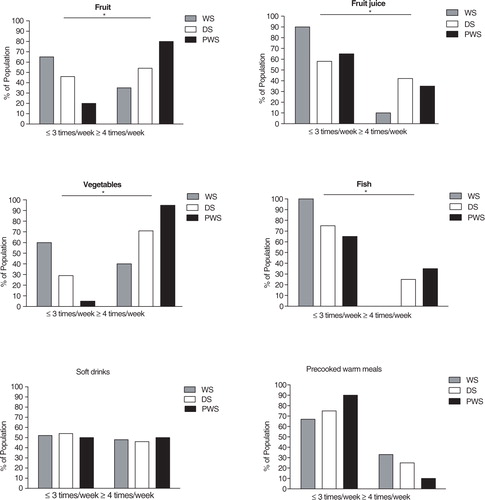
Table 2 Carotenoids in plasma and omega-3 fatty acids in erythrocytes by diagnosis
Fig. 2 The association between BMI and total carotenoids by diagnosis. Scatter plot include participants with DS (n=40), participants with PWS (n=20), and participants with WS (n=21). The correlation was tested by use of person's correlation and significant for persons with DS, r−0.33, p=0.039.
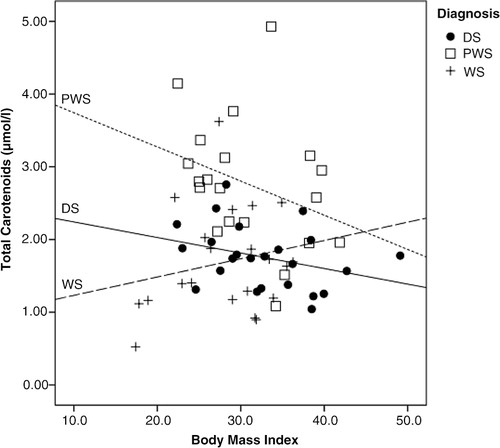
Fig. 3 Proportion low- and high-frequency consumers based on living arrangement. Intake frequencies are presented as a percentage of the population with DS living with relatives (n=16) or in communities (n=24).
*p<0.05 when participants with DS living in community residences were compared to diagnose specific peers living with relatives using chi-square tests.
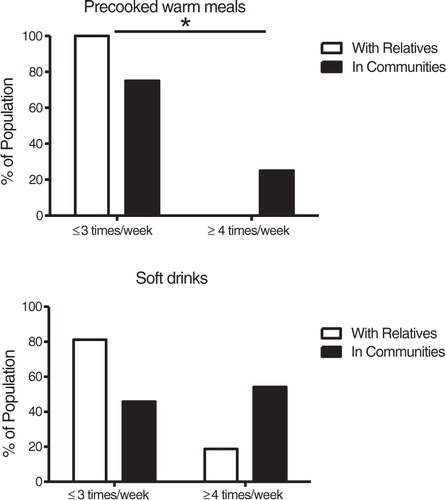
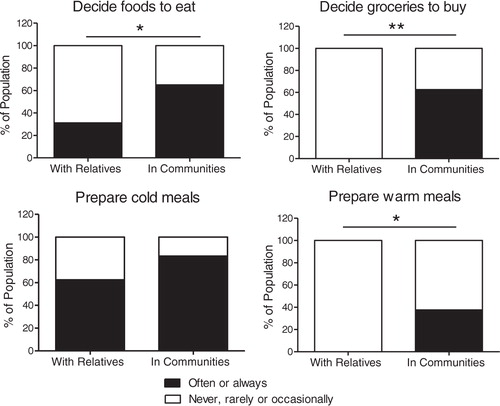
Fig. 4 Food-related autonomy for persons with Down syndrome in different living arrangements. Degrees of participation are presented as a proportion (%) of the population living with relatives (n=16) or in communities (n=24).
*p<0.05 when participants living in community residences were compared to participants living with relatives using chi-square tests.
**p<0.001 when participants living in community residences were compared to participants living with relatives using chi-square tests.