Figures & data
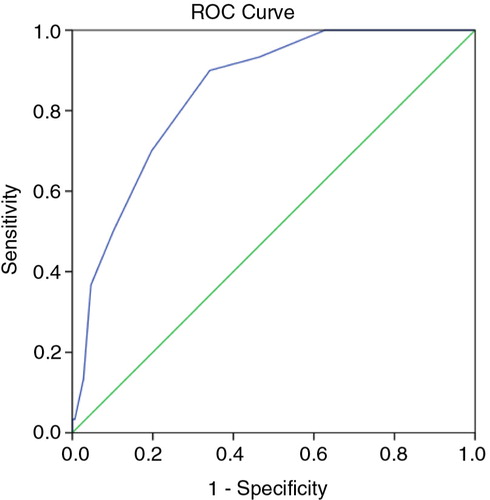
Fig. 1 Overview of the development and validation process of NutricheQ.
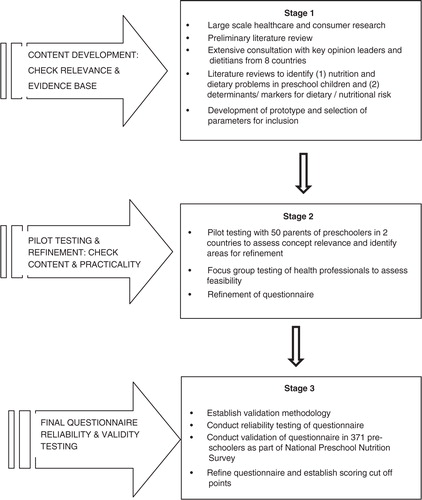
Table 1 Details of items asked in NutricheQ questionnaire
Table 2 Descriptive characteristics of Irish preschool children aged 1–3 years from the National Preschool Nutrition Survey who participated in the NutricheQ validation study
Table 3 Pearson's correlations between mean daily nutrient intake, mean daily intake of fruit and vegetables, and NutricheQ score for Sections 1 and 2 and for the total NutricheQ scores (Sections 1 and 2)
Table 4 Mean daily intakes of nutrients [% total energy (TE), mg or µg/10 MJ/day] for Irish children from the National Preschool Nutrition Survey by quartiles of total NutricheQ score (Sections 1 and 2)
Table 5 Mean daily food group intake (g/day) for Irish children from the National Preschool Nutrition Survey by quartiles of total NutricheQ score (Sections 1 and 2)
Fig. 2 Receiver-operating characteristic (ROC) curve comparing NutricheQ total scores to an objective rating of nutritional risk based on analysis of actual dietary intake and anthropometric measurement using objective criteria. Area under the curve (AUC)=85%.