
Figures & data
Table 1 Results of composition analysis and periodate oxidation of LBP-d and LBP-e
Fig. 1 Gas chromatographs of Smith degradation of LBP-d and LBP-e. a: LBP-d, b: LBP-e. 1: Glycerol, 2: erythritol, 3: fucose, 4: arabinose, 5: glucose, 6: mannose, 7: galactose.
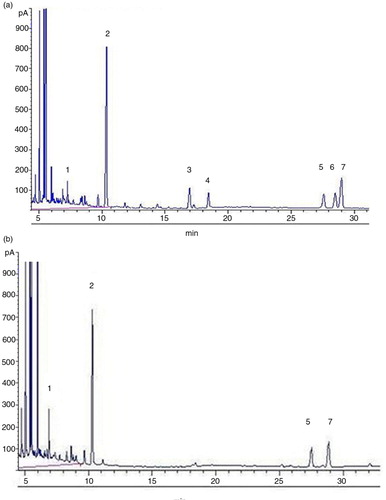
Table 2 Inhibition activities of LBP-d and LBP-e on SMMC-7721 cells
Fig. 2 Morphological changes of cells treated by LBP. a, b, c show images of SMMC-7721 cells observed by inverted microscope (500×), and d, e, f are images observed by laser scanning confocal microscope (500×); a and d are the control groups; b and e are cells treated with LBP-d (400 mg L−1) for 4 days; c and f are cells treated with LBP-e at 400 mg L−1 for 4 days.
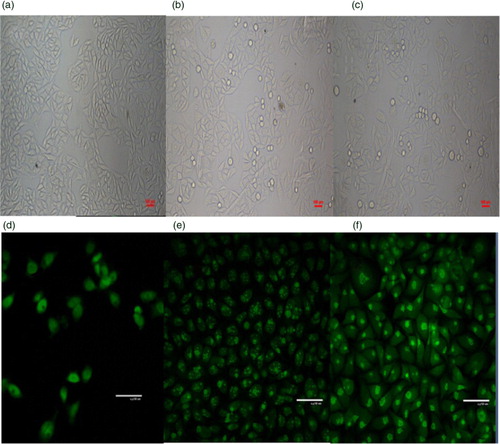
Table 3 Effects of LBP-d and LBP-e on cell cycle distribution of SMMC-7721 cells (n=3)
Table 4 Effects of LBP-d and LBP-e on concentration of Ca2+ in the cytoplasm of SMMC-7721 cells