Figures & data
Table 1 mRNA primer design of the key enzymes in pancreatic tissue
Fig. 1 Effect of GD on the body weight of diabetic mice 7–10 weeks old. ad means oral administration. Treatment group L: 1.2% GD-treated diabetic group; treatment group H: 4.8% GD-treated diabetic group. Data are expressed as mean±SD. *p<0.05 and **p<0.01, respectively, versus the normal group; # p<0.05 versus the diabetic model group.
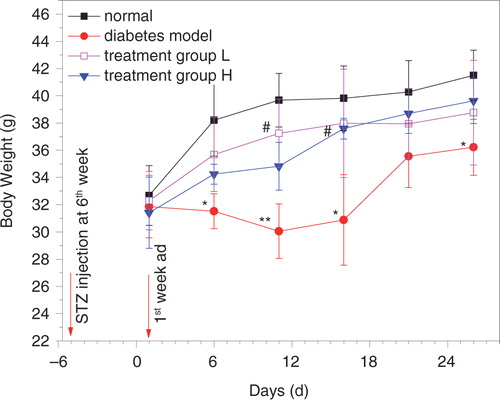
Fig. 2 Effect of GD on FBG levels of diabetic mice. FBG: fasting blood glucose; treatment group L: 1.2% GD-treated diabetic group; treatment group H: 4.8% GD-treated diabetic group. Data are expressed as mean±SD. **p<0.01, versus the normal group; # p<0.05 and ## p<0.01, respectively, versus the diabetic model group.
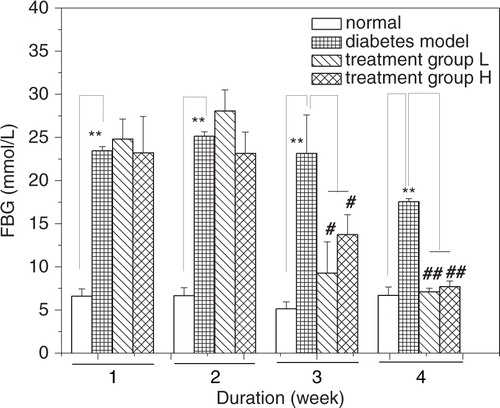
Table 2 Effects of GD on the GSH-Px as well as T-SOD activities and MDA levels in mice
Fig. 3 Effect of GD on the serum insulin level in diabetic mice. After 4 weeks of GD treatment in high-fat diet and STZ-induced type 2 diabetic mice, the serum insulin level was measured in mice during the fasting state. Treatment group L: 1.2% GD-treated diabetic group; treatment group H: 4.8% GD-treated diabetic group. Data are expressed as mean±SD. **p<0.01, versus the normal group; # p<0.05 and ## p<0.01, respectively, versus the diabetic model group.
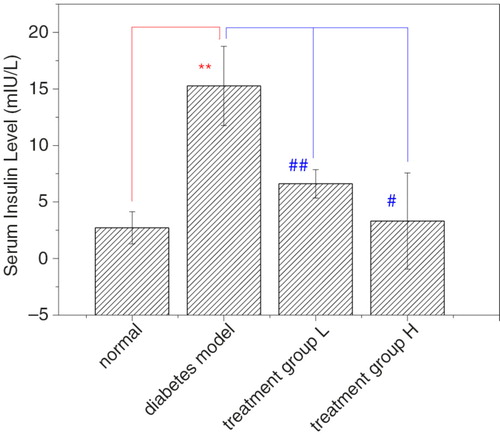
Table 3 Effect of GD on blood lipids and liver glycogen levels in diabetic mice
Fig. 4 Effect of GD on AKT, PI3K and PDK-1 mRNA expressions in pancreatic tissues of diabetic mice. The mRNA relative expressions of AKT, PI3K, and PDK-1 were tested using qPCR. Treatment group L: 1.2% GD-treated diabetic group; treatment group H: 4.8% GD-treated diabetic group. Data are mean±SD. *p<0.05 and **p<0.01, respectively, versus the normal group; # p<0.05 and ## p<0.01, respectively, versus the diabetic model group.
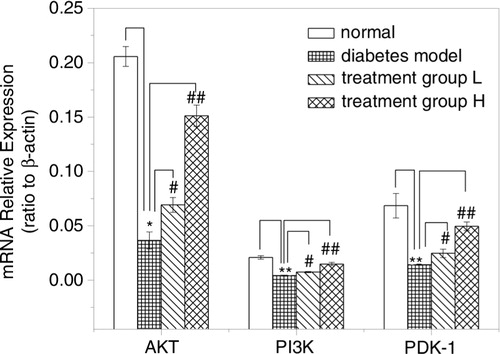
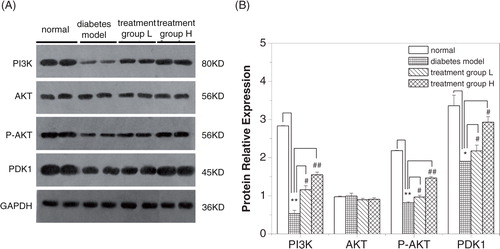
Fig. 5 Effect of GD on AKT, P-AKT, PI3K, and PDK-1 protein expressions in pancreatic tissues of diabetic mice. (A) Western blot analysis of AKT, P-AKT, PI3K, and PDK-1 protein expressions. (B) Quantitative analysis of AKT, P-AKT, PI3K and PDK-1 protein expressions. Treatment group L: 1.2% GD-treated diabetic group; Treatment group H: 4.8% GD-treated diabetic group. Data are given by mean±SD. *p<0.05 and **p<0.01, respectively, versus the normal group; # p<0.05 and ## p<0.01, respectively, versus the diabetic model group.