Figures & data
Fig. 1 Identification of apigenin as an inhibitor of 26S proteasome in HEK293A-luciferase-cODC cells. (a) Chemical structure of apigenin. (b) HEK293A-luciferase-cODC cells were seeded in 96-well plates and treated in the presence of indicated concentrations of apigenin or bortezomib for 3 h. (c) Concentration–response curve for apigenin. The calculated EC50 value was 4.08 µM. (d) HEK293A-luciferase-cODC cells were seeded in 96-well plates and treated with 10 µM apigenin for the indicated time, or treated with 1 µM MG132 for 4 h. Results are representative of three separate experiments. The error bars represent the standard deviation of the measurements. (*) p<0.05, (**) p<0.01, (***) p<0.001 compared to the DMSO control.
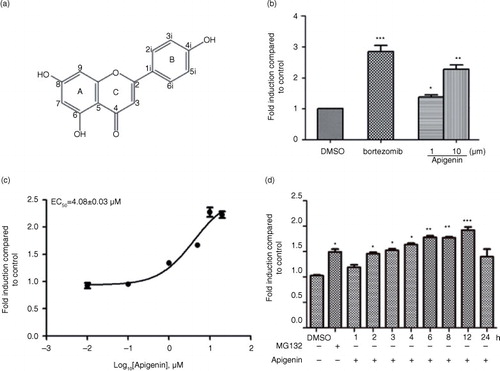
Fig. 2 Inhibitory effect of apigenin on 26S proteasome activity. The purified human 26S proteasome (0.1 µg) was treated with different concentrations of apigenin and (a) 40 µM Suc-Leu-Leu-Val-Tyr-AMC (for the chymotrypsin-like activity), (b) 40 µM Ac-Arg-Leu-Arg-AMC (for the trypsin-like activity), (c) 40 µM Z-Nle-Pro-Nle-Asp-aminoluciferin (for the caspase-like activity) for 2 h at 37°C. (d) HeLa cells were treated with the indicated concentrations of apigenin or 10 µM MG132 for 3 h, and the cell lysates were probed with anti-ubiquitin antibody. GAPDH was used as an internal control.
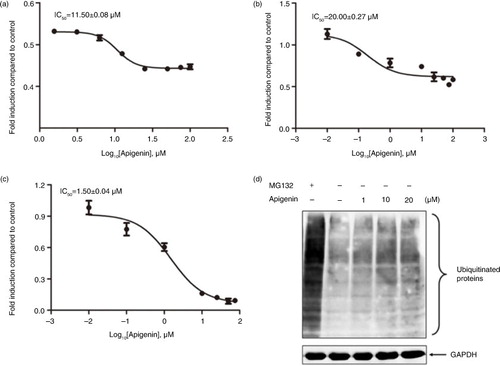
Fig. 3 Molecular docking of apigenin on the proteasome subunits. (a–c) Apigenin was docked to β5 subunit of the proteasome. The energy of the inhibitory pose and the number of runs (out of 100) that adopted the inhibitory pose was shown below (a). The threonine catalytic residue and all amino acids in the S1 pocket of β5 subunit involved in the formation of H-bonds (b) and hydrophobic interactions (c) with apigenin are highlighted. (d–f) Apigenin was docked to β2 subunit of the proteasome. The energy of the inhibitory pose and the number of runs (out of 100) that adopted the inhibitory pose was shown below (d). The threonine catalytic residue and all amino acids in the S1 pocket of β2 subunit involved in the formation of H-bonds (e) and hydrophobic interactions (f) with apigenin are highlighted. (g–i) Apigenin was docked to β1 subunit of the proteasome. The energy of the inhibitory pose and the number of runs (out of 100) that adopted the inhibitory pose was shown below (g). The threonine catalytic residue and all amino acids in the S1 pocket of β1 subunit involved in the formation of H-bonds (h) and hydrophobic interactions (i) with apigenin are highlighted.
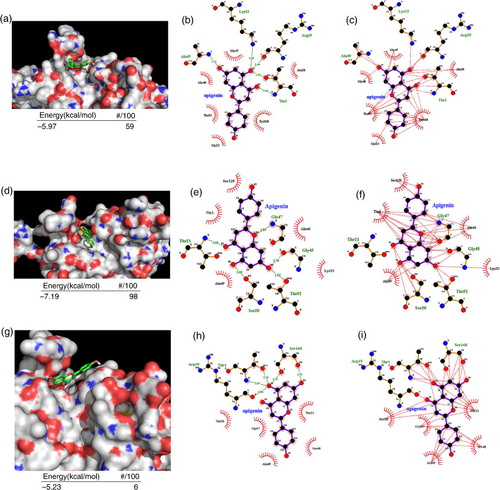
Fig. 4 Apigenin enhances IFN-α/β-induced JAK/STAT activation. (a) HepG2-ISRE-Luc2 cells were seeded in 96-well plates (1×10⁴/well) and treated with the various concentrations of apigenin for 2 h, then with 200 U/mL IFN-α or IFN-β for 24 h. (b) HEK293A cells were incubated with indicated concentrations of apigenin for 2 h, then with 2000 U/mL IFN-α for another 1 h. The cell lysates were immunoblotted with phospho-STAT1 (Tyr701), STAT1, phospho-STAT2 (Tyr690), or STAT2 antibodies. The quantitative results are shown. (c) HEK293A cells were treated 200 U/mL IFN-α with or without 10 µM bortezomib or the indicated concentrations of apigenin for 24 h. Real-time quantitative reverse transcription-PCR was used to determine the mRNA expression of PKR or 2’,5’-OAS1. The result is presented as induction (n-fold) relative to basal levels in untreated cells. GAPDH was used as an internal control. (*) p<0.05, (**) p<0.01, (***) p<0.001 versus control (n=3).
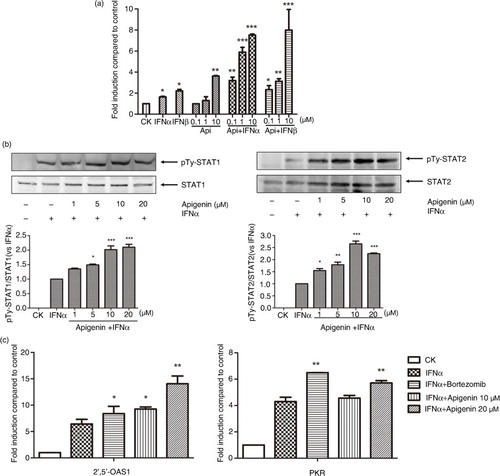
Fig. 5 Apigenin inhibits IFN-α-induced degradation of IFNAR1. (a) HEK293A cells were treated with 20 µM cycloheximde (CHX) for 2 h, and then with apigenin (1 µM, 10 µM, 25 µM) for 12 h before the treatment with IFN-α (1×10⁴ U/mL) for an additional 2 h. The cell lysates were immunoblotted with anti-IFNAR1 antibody. GAPDH staining is shown as a loading control. (b) HeLa cells were transfected with pCMV-ubiquitin plasmid for 48 h and incubated with MG132 (20 µM) or apigenin (20 µM) for 12 h before treatment with IFN-α (1×10⁴ U/mL) for another 2 h. Cell lysates were immunoprecipitated with the IFNAR1 antibody. Immunoblotting was performed using ubiquitin antibody. GAPDH antibody staining represents 5% of the total cell lysates used in immunoprecipitation. (c) HeLa cells were treated with 20 µM CHX, IFN-α (1×10⁴ U/mL) or apigenin (20 µM) for the indicated time. The cell lysates were immunoblotted with anti-IFNAR1 antibodies. GAPDH staining is shown as a loading control.
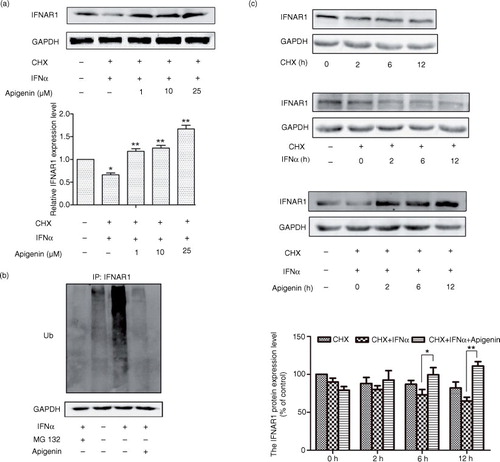
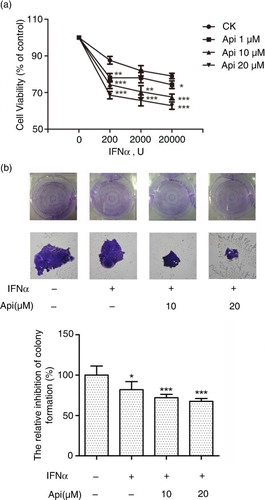
Fig. 6 Apigenin potentiates the inhibitory effect of IFN-α on cancer cell viability. (a) The HeLa cells (5×10³ cells/well) were seeded in 96-well plates and treated under indicated concentrations of apigenin and IFN-α for 72 h. Cell viability was measured by Alamar Blue assay and the values are expressed as the percentage cell viability relative to the DMSO control. (b) The HeLa cells growing in 6-well plates were treated with the indicated concentrations of apigenin and IFN-α (1×10⁴ U/mL) for 12 days, and then colonies were visualized by staining with crystal violet and counted manually. The bar graph was obtained by calculating the percentages of colony numbers from each well relative to the DMSO-treated control. (*) p<0.05, (**) p<0.01, (***) p<0.001 versus control (n=3).