
Figures & data
Fig. 1 Body weight and fat mass content in animals of different ages fed a control, an HF60 or an HP diet (Experiment 1), or a control or an HF45 diet (Experiment 2). Diets were administered to 2-month-old Wistar rats during 4 months. HF and HP diets were offered in isocaloric amounts to control animals and water was offered ad libitum. Body weight was followed thrice a week. Results represent mean±SEM (n=5–7). *indicates values significantly different versus control animals (Student's t-test, p<0.05 or indicated when different).
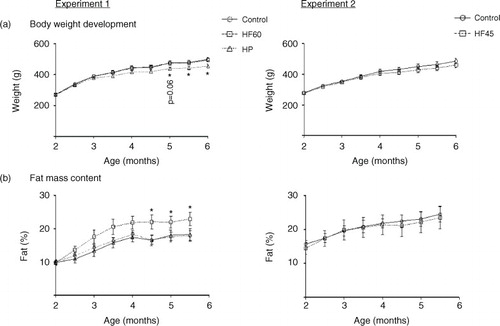
Fig. 2 Circulating glucose, insulin levels and HOMA-IR index measured in the same animals and conditions described in . All parameters were measured in the fed state. Results represent mean±SEM (n=5–7). Values not sharing a common letter (a, b) are significantly different (one-way ANOVA, p<0.05); no letter indicates no significant differences; *indicates values significantly different versus control animals (Student's t-test, p<0.05).
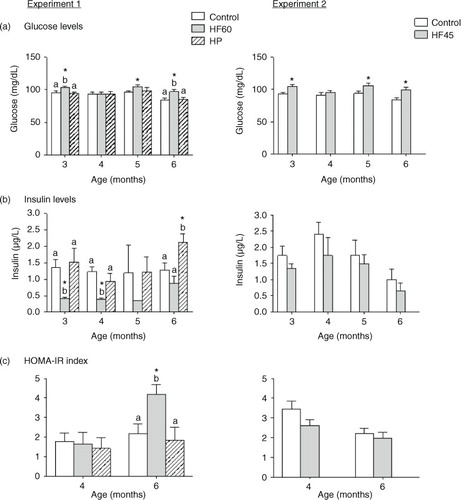
Fig. 3 Circulating triacylglycerols (TG) and non-esterified fatty acids (NEFA) measured in the same animals and conditions described in . All parameters were measured in the fed state. Results represent mean±SEM (n=5–7). Values not sharing a common letter (a, b) are significantly different (one-way ANOVA, p<0.05); no letter indicates no significant differences; *indicates values significantly different versus control animals (Student's t-test, p<0.05 or indicated when different).
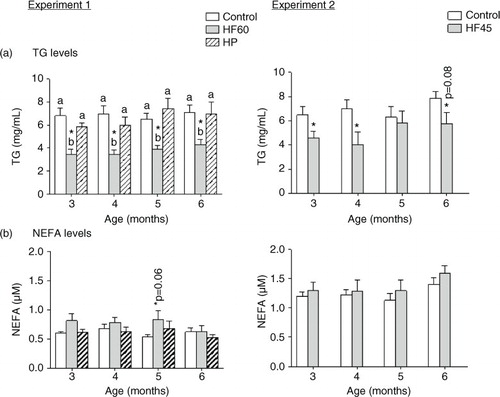
Fig. 4 Liver triacylglycerol (TG) and total lipid content in 6-month-old animals fed during 4 months a control, an HF60 or an HP diet (Experiment 1), or a control or an HF45 diet (Experiment 2). All diets were offered in isocaloric amounts to control animals and water was offered ad libitum. Values not sharing a common letter (a, b) are significantly different (one-way ANOVA, p<0.05); no letter indicates no significant differences; *indicates values significantly different versus control animals (Student's t-test, p<0.05 or indicated when different).
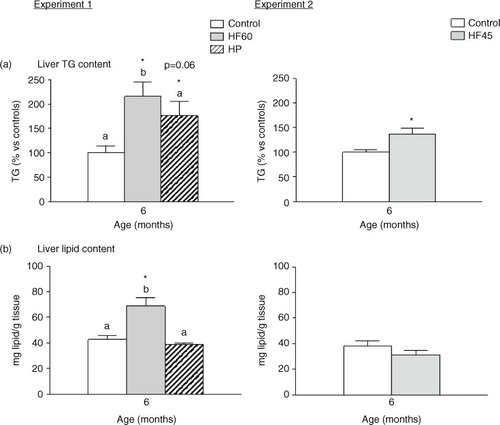
Fig. 5 Cpt1a mRNA gene expression in PBMC (a) in animals of different ages and (b) in liver of 6-month-old animals. Cpt1a mRNA was measured by real-time RT-PCR in animals fed a control, an HF60 or an HP diet (Experiment 1), or a control or an HF45 diet (Experiment 2). Diets were administered to 2-month-old Wistar rats during 4 months. HF and HP diets were offered in isocaloric amounts to control animals and water was offered ad libitum. Results represent mean±SEM (n=5–7) of ratios of specific mRNA levels relative to integrin beta 1 in PBMC and beta-actin in liver, and expressed as a percentage of the value of control group at the age of 3 (for PBMC) or 6 months (for liver) that was set to 100%. Values not sharing a common letter (a, b) are significantly different (one-way ANOVA, p<0.05); no letter indicates no significant differences; *indicates values significantly different versus control animals (Student's t-test, p<0.05 or indicated when different).
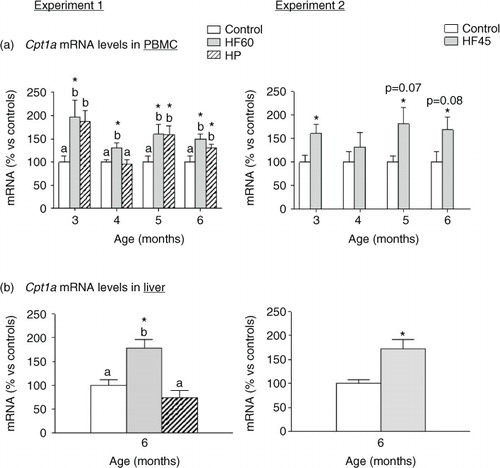
Fig. 6 Gene expression (mRNA) of genes involved in fatty acid oxidation (Mlycd), fatty acid synthesis (Acc1 and Fasn), adipogenesis (Pparg) and fatty acid transport (Slc27a2) in PBMC of the same animals and conditions described in , measured by real-time RT-PCR. Results represent mean±SEM (n=5–7) of ratios of specific mRNA levels relative to integrin beta 1, expressed as a percentage of the value of control group at the age of 3 months that was set to 100%. Values not sharing a common letter (a, b) are significantly different (one-way ANOVA, p<0.05); no letter indicates no significant differences; *indicates values significantly different versus control animals (Student's t-test, p<0.05 or indicated when different).
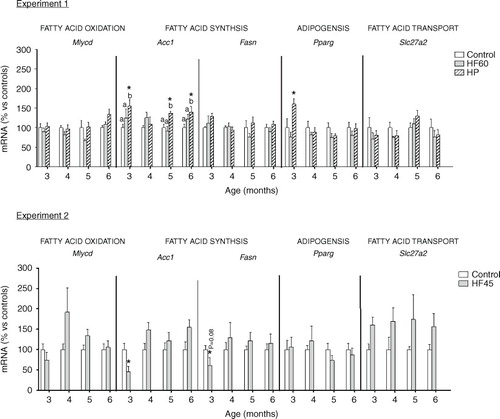
Fig. 7 Gene expression (mRNA) of the glycolytic gene Eno1 and of the glucose transporter Glut4 in PBMC of the same animals and conditions described in , measured by real-time RT-PCR. Results represent mean±SEM (n=5–7) of ratios of specific mRNA levels relative to integrin beta 1, expressed as a percentage of the value of control group at the age of 3 months that was set to 100%. Values not sharing a common letter (a, b) are significantly different (one-way ANOVA, p<0.05); no letter indicates no significant differences; *indicates values significantly different versus control animals (Student's t-test, p<0.05 or indicated when different).
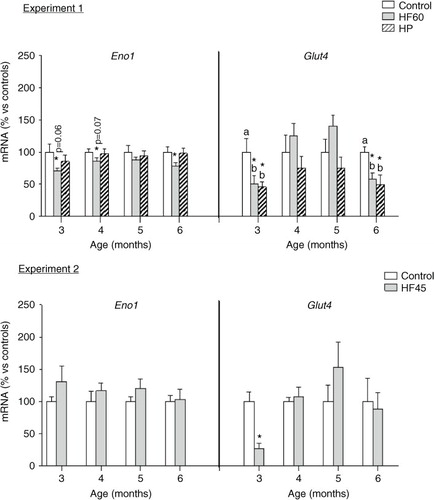
Table 1 Correlations of Cpt1a mRNA expression in PBMC and liver with HOMA-IR and lipid parameters, either considering fat as a confounding factor or not