1,105
Views
6
CrossRef citations to date
0
Altmetric
Original Articles

Associations between urbanisation and components of the health-risk transition in Thailand. A descriptive study of 87,000 Thai adults

, , , , , & show all
Article: 1914 | Received 07 Dec 2008, Published online: 30 Apr 2009

Figures & data

Table 1. Conceptual framework for health determinants at different levels in relation to health outcomes with potential links to urbanisation

Figure 1.  High-level socio-economic determinants. Graphs show the percent of males (

) and females (
) by level of urbanisation and age group in the 2005 Thai cohort of 86,008 university students. Text shows wording of the questions (Q), answers available (A) and the criterion producing the binary variable (C). RR = lived in rural area when 10–12yo and in 2005; RU = rural when 10–12yo, urban in 2005; UR = urban 10–12yo, rural 2005; UU = urban 10–12yo and 2005.

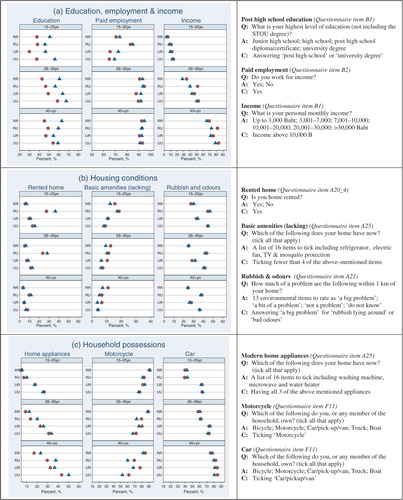
Figure 2.  Mid-level environmental determinants. Graphs show the percent of males (

) and females (
) by level of urbanisation and age group in the 2005 Thai cohort of 86,008 university students. Text shows wording of the questions (Q), answers available (A) and the criterion producing the binary variable (C). RR = lived in rural area when 10–12yo and in 2005; RU = rural when 10–12yo, urban in 2005; UR = urban 10–12yo, rural 2005; UU = urban 10–12yo and 2005.

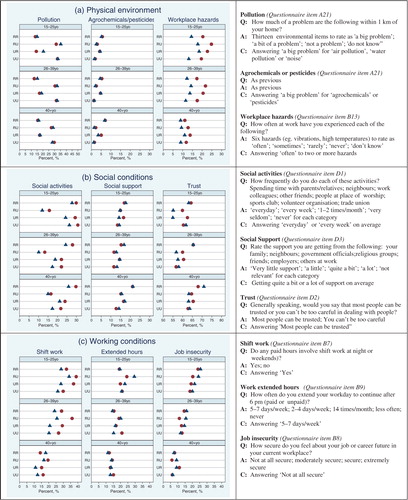
Figure 3.  Proximate-level behavioural determinants. Graphs show the percent of males (

) and females (
) by level of urbanisation and age group in the 2005 Thai cohort of 86,008 university students. Text shows wording of the questions (Q), answers available (A) and the criterion producing the binary variable (C). RR = lived in rural area when 10–12yo and in 2005; RU = rural when 10–12yo, urban in 2005; UR = urban 10–12yo, rural 2005; UU = urban 10–12yo and 2005.

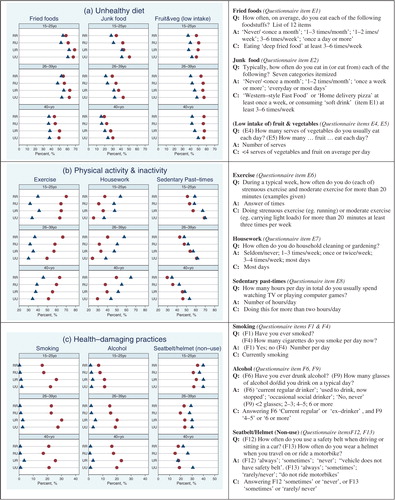
Figure 4.  Health outcomes. Graphs show the percent of males (

) and females (
) by level of urbanisation and age group in the 2005 Thai cohort of 86,008 university students. Text shows wording of the questions (Q), answers available (A) and the criterion producing the binary variable (C). RR = lived in rural area when 10–12yo and in 2005; RU = rural when 10–12yo, urban in 2005; UR = urban 10–12yo, rural 2005; UU = urban 10–12yo and 2005.

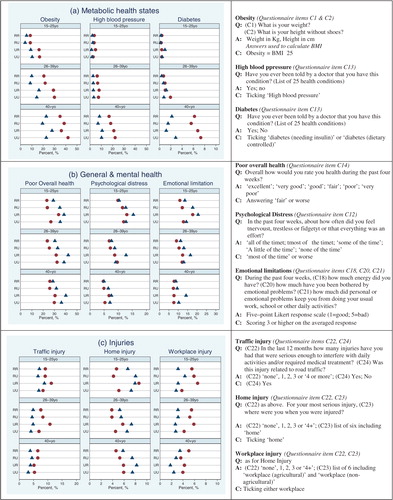
Table 2. Distribution of urbanisation status by age, sex and region