Figures & data
Figure 1. Thermal stress-related mortality as deviation from the expected value for selected European cities and areas 1986–1996 during different thermal stress categories (after 36 and 37). −3, strong cold stress; −2, moderate cold stress; −1, slight cold stress; 0, thermal comfort (no thermal stress); 1, slight heat load; 2, moderate heat load; 3, strong heat load, taking acclimatisation into account.
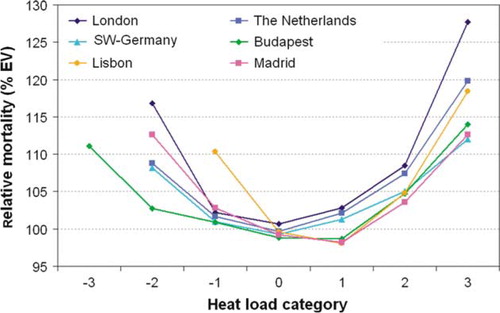
Table 1. Perceived Temperature, Predicted Mean Vote (According to Citation6), and corresponding thermal stress (Initial conditions without acclimatisation; negative values are ‘cold stress’ and positive values are ‘heat load’)
Figure 2. Example of daily values of Perceived Temperature at 12 UTC (black line) for the weather station Lisbon (Portugal) from March to September 2003 Citation36. Compared to the coloured lines indicate the variable thresholds for the different thermal stress categories specifying acclimatisation.
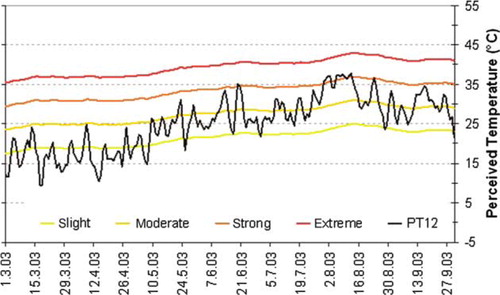
Figure 3. Mean annual frequency of comfortable conditions (no thermal stress) at 12 MLT (=noon) taking acclimatisation into account based on ECHAM4/T106-data 1971–1980.

Figure 4. (a–d) Mean annual frequency of exceeding the threshold for (a) heat load, (b) moderate heat load, (c) strong heat load and (d) extreme heat load at 12 MLT taking acclimatisation into account, based on ECHAM4/T106-data 1971–1980.
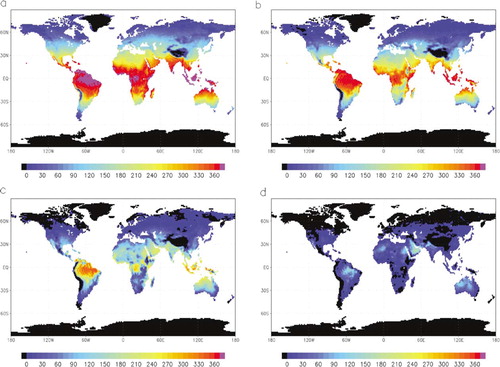
Figure 5. (a–d) Mean annual frequency of exceeding the threshold for (a) cold stress, (b) moderate cold stress, (c) strong cold stress and (d) extreme cold stress at 12 MLT taking acclimatisation into account, based on ECHAM4/T106-data 1971–1980.
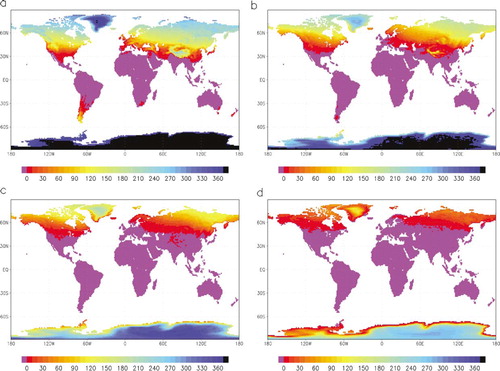
Figure 6. Difference of the mean annual frequency of comfortable conditions (no thermal stress) at 12 MLT between future and recent climate taking acclimatisation into account, based on ECHAM4/T106-data (2041–2050 and 1971–1980).

Figure 7. (a–d) Difference of the mean annual frequency of exceeding the threshold for (a) heat load, (b) moderate heat load, (c) strong heat load and (d) extreme heat load at 12 MLT taking acclimatisation into account, based on ECHAM4/T106-data (2041–2050 and 1971–1980).
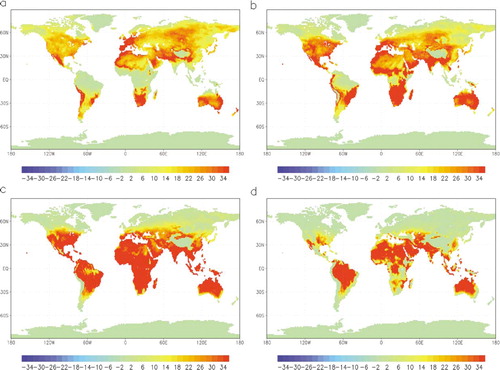
Figure 8. (a–d) Difference of the mean annual frequency of exceeding the threshold for (a) cold stress, (b) moderate cold stress, (c) strong cold stress and (d) extreme cold stress at 12 MLT taking acclimatisation into account, based on ECHAM4/T106-data (2041–2050 and 1971–1980).
