Figures & data
Figure 1. Mean systolic blood pressure (mmHg) (95%CI) in nine HDSS sites, by gender.
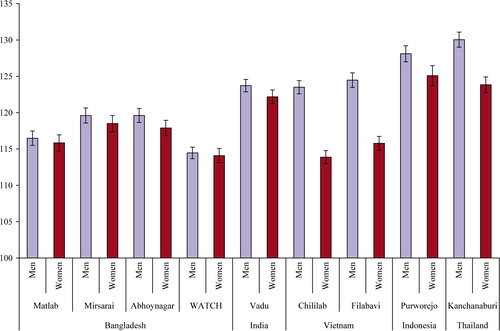
Figure 2. Distribution of diastolic blood pressure (mmHg) and its 95%CI in nine HDSS sites by gender.
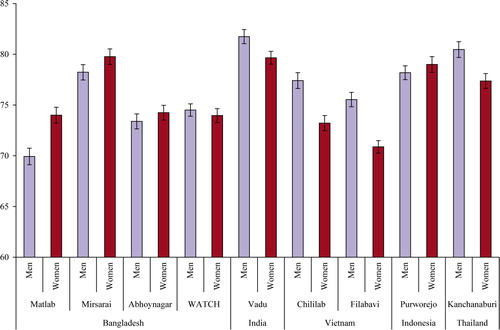
Table 1. Prevalence (%) of raised blood pressure (95%CI) in nine HDSS sites, by different cut points and gender
Table 2. Percent (95%CI)) of men and women on treatment by different blood pressure groups in nine HDSS sites
Table 3. Association (OR and 95%CI) between demographic variables and raised blood pressure (≥140/90 and/or on treatment) in nine HDSS sites