Figures & data
Table 1. Descriptive characteristics of the cross-sectional and panel samples
Table 2. Distribution of good, fair and poor self-reported health in the cross-sectional sample (N=101,396) during 1990–2007
Fig. 1. Self-reported health in men and women by educational level, Västerbotten County, 1990–2007 (the cross-sectional sample N=101,396). The figure is adjusted for age and marital status.
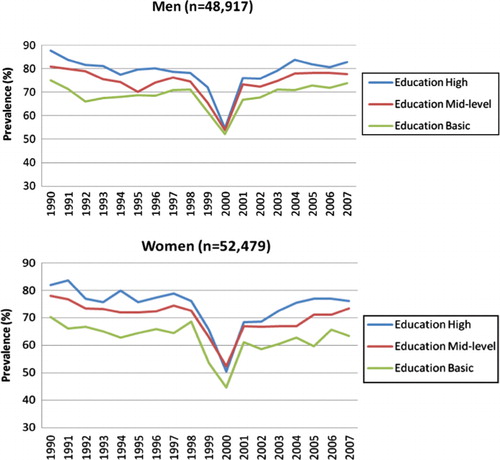
Table 3. Change in the self-reported health at 10-year follow-up, stratified by self-reported health at baseline (the panel sample N=25,695)*
Table 4. Deterioration of self-reported health at 10-year follow-up by sample characteristics (the panel sample N=25,695)
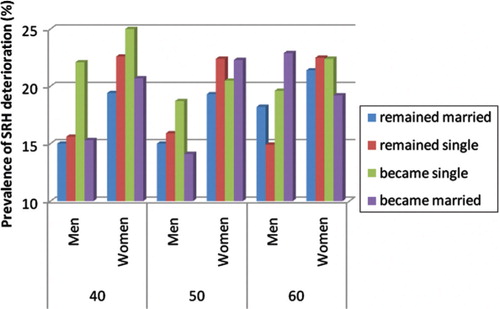
Fig. 2. Deteriorated self-reported health at 10-year follow-up (the panel sample N=25,695). This figure is stratified by follow-up sex, age and change in marital status and is adjusted by educational level at follow-up.