Figures & data
Table 1. Definitions of physical activity levels
Figure 1. Physical activity level trends in Northern Sweden from 1990 to 2007 among men and women and by educational levels. Cross-sectional data from the Västerbotten Intervention Programme.
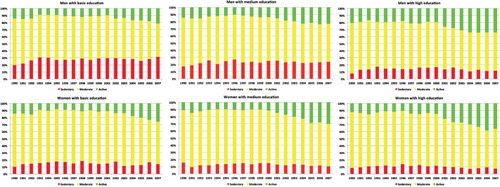
Table 2. Prevalence of physical activity levels among men and women by year and education, adjusted for age
Figure 2. Ten-year changes in prevalence of sedentary behaviour at the individual level by sex and education. Cohort data from the Västerbotten Intervention Program.
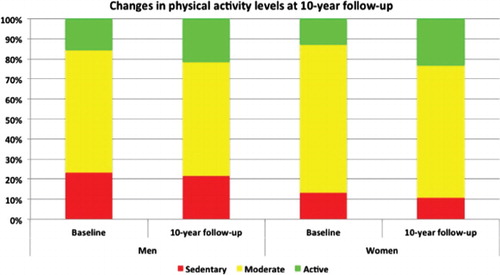
Figure 3. Ten-year changes in prevalence of sedentary behaviour at the individual level by sex and education. Cohort data from the Västerbotten Intervention Program.
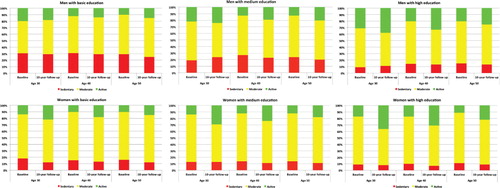
Table 3. Age-adjusted proportion of physical activity patterns at baseline and 10-year follow-up among men and women (N=26,382)
