Figures & data
Fig. 1. The WHO model of the International Classification of Functioning, Disability, and Health (ICF). Source: WHO, 2001.
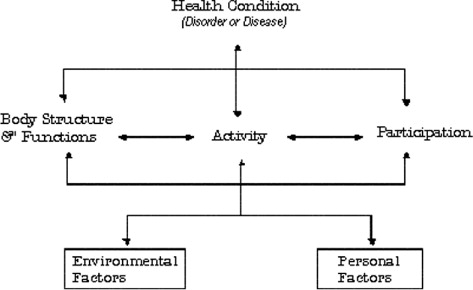
Fig. 2. Development of the absolute number of reported injuries (logarithm to base 10) by year and world region from 1970 to 2010 over all types of natural disaster; the solid line parallel to the abscissa means 100,000 injuries (lg (100,000) = 5). Source: Own calculation based on data from www.emdat.be; numbers of injuries were extracted by year and region.
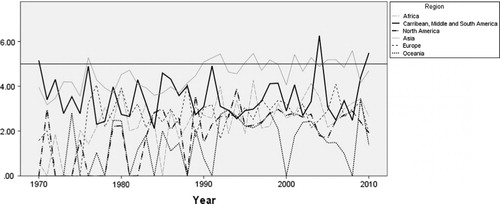
Fig. 3. Development of mean numbers of injuries and deaths due to all types of natural disaster from 1970 to 2010 in the Asian continent; error bars indicate 95% confidence intervals (for mathematical reasons, confidence intervals for the period 1970 to 1979 reach below zero). Source: Own calculation on the basis of data from www.emdat.be.
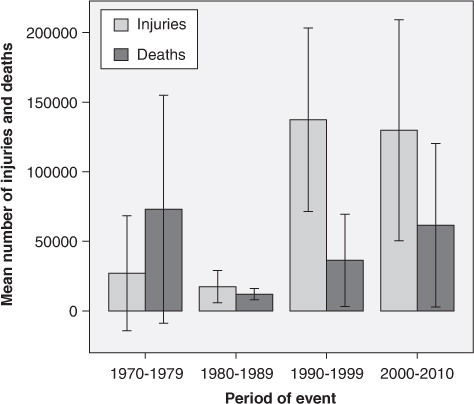
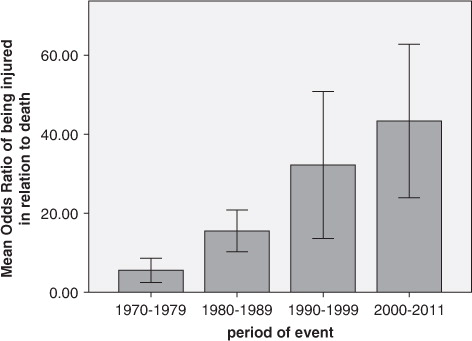
Fig. 4. Odds ratio of being injured in an earthquake in relation to death from 1970 to 2011 (January) and over all continents; error bars indicate 95% confidence intervals. Source: Own calculation on the basis of data from www.emdat.be.